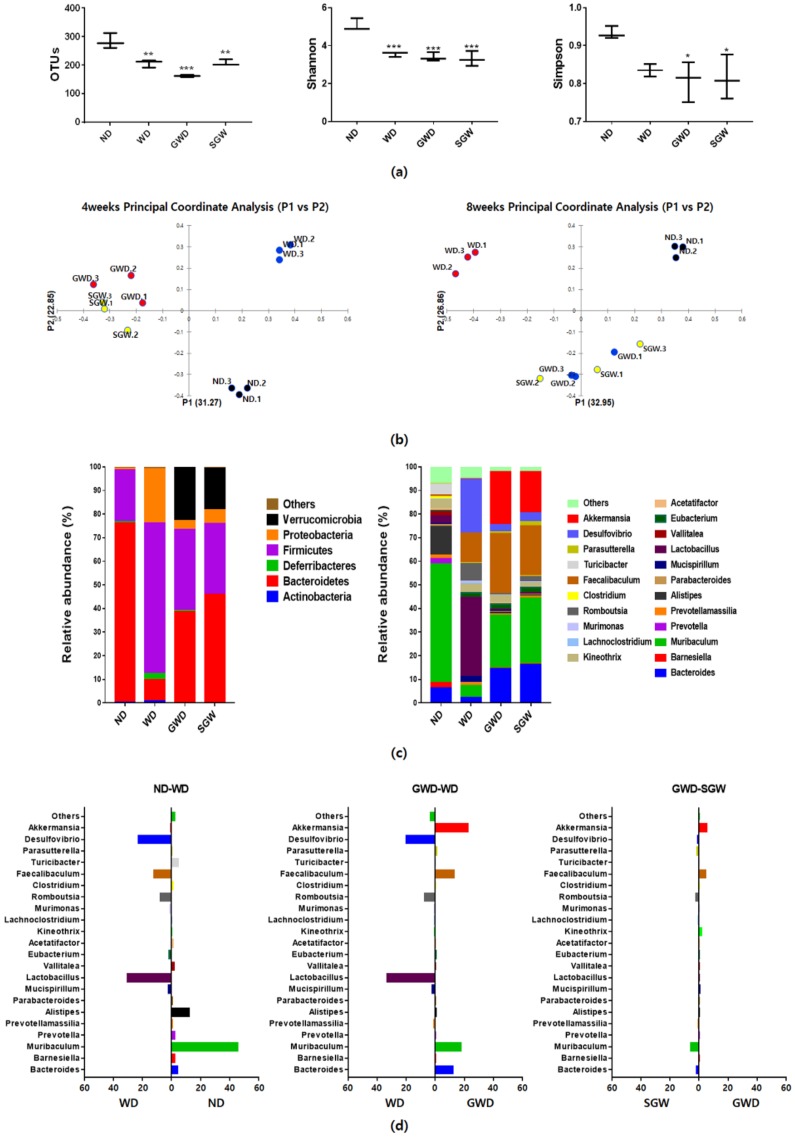
Figure 2.
Microbial community analysis of feces samples. (a) Operational taxonomic unit levels, Shannon’s and Simpson diversity indices; (b) Bray–Curtis dissimilarity-based principal coordinates analysis; (c) Relative abundances plot of bacterial phyla and genus; (d) Different abundance of gut microbial composition by diet. Data are presented as the mean ± SEM for three cages per each group (* p < 0.05, ** p < 0.01, *** p < 0.001 vs. ND).

