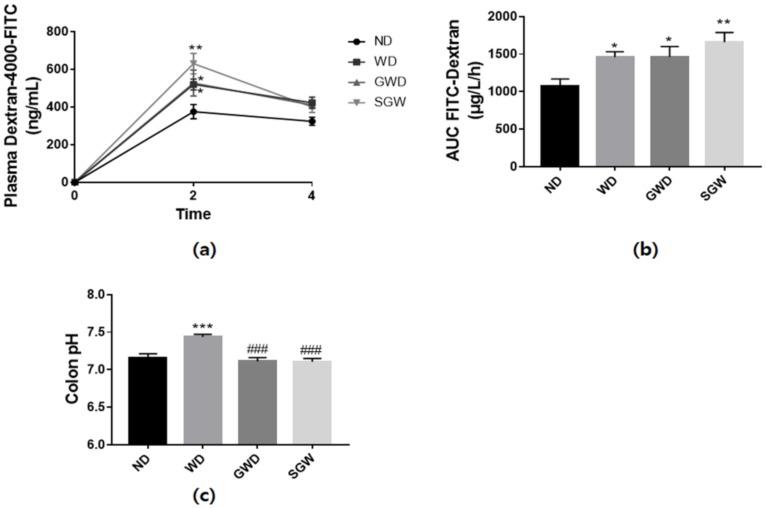
Figure 3.
Diet-induced changes of gut barrier function. (a) Plasma fluorescein isothiocyanate (FITC)-dextran concentration during the gut permeability test; (b) Area under the curve (AUC) of plasma FITC dextran levels; (c) Colon pH levels. Data are presented as mean ± SEM for 9 mice per each group. (* p < 0.05, ** p < 0.01, *** p < 0.001 vs. ND; ### p < 0.001 vs. WD).

