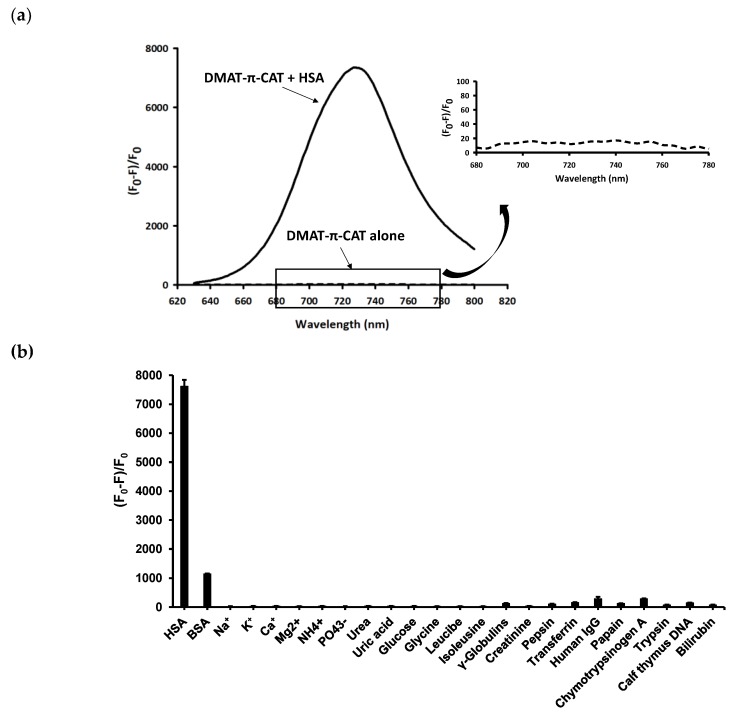
Figure 1.
(a) Fluorescence spectra of DMAT-π-CAP (5 μM) in the absence and presence of HSA (10 μM). A magnified view of the boxed region is shown in the inset. (b) Fluorescence intensity of DMAT-π-CAP (5 μM) in the presence of various bioanalytes [10 μM except BSA (2 μM)]. (F0-F)/F0 indicates relative fluorescence intensity. Data are the mean ± standard error (n = 3).

