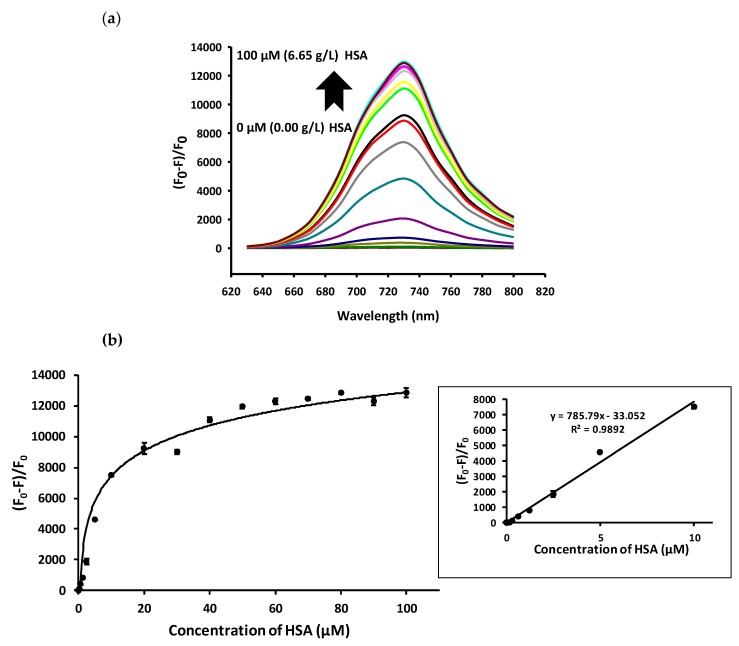
Figure 2.
(a) Emission fluorescence spectra of DMAT-π-CAP (5 μM, λem = 730 nm) upon addition of increasing concentration of HSA (0, 1.25, 2.5, 5, 10, 20, 30, 40, 50, 60, 70, 80, 90, and 100 μM). (b) HSA-dependent change in the fluorescence intensity of DMAT-π-CAP. Inset shows the linear relationship between the fluorescence intensity of DMAT-π-CAP (5 μM) at 730 nm and the concentrations of HSA (0–10 μM). (F0-F)/F0 indicates relative fluorescence intensity.

