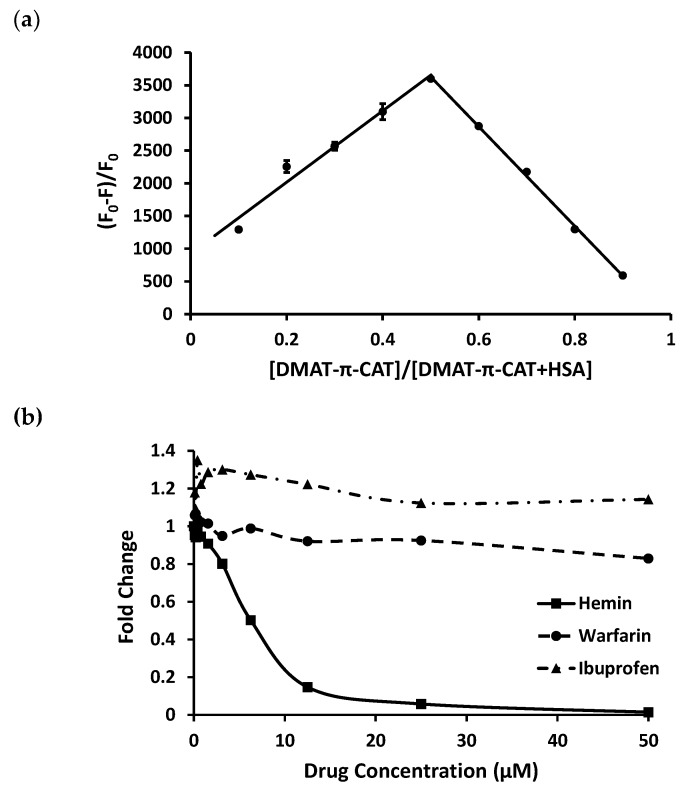
Figure 3.
(a) Job’s plot analysis. Fluorescence intensity of a mixture of DMAT-π-CAP and HSA (total molar concentration = 10 μM at PBS) was measured at different molar ratios of the two components (0.1–0.9) (λem = 730 nm). (F0–F)/F0 indicates relative fluorescence intensity. (b) Changes in the fluorescence intensity (λem = 730 nm) from a mixture of DMAT-π-CAP (5 μM) and HSA (10 μM) upon addition of site-specific markers (warfarin, ibuprofen, and hemin).

