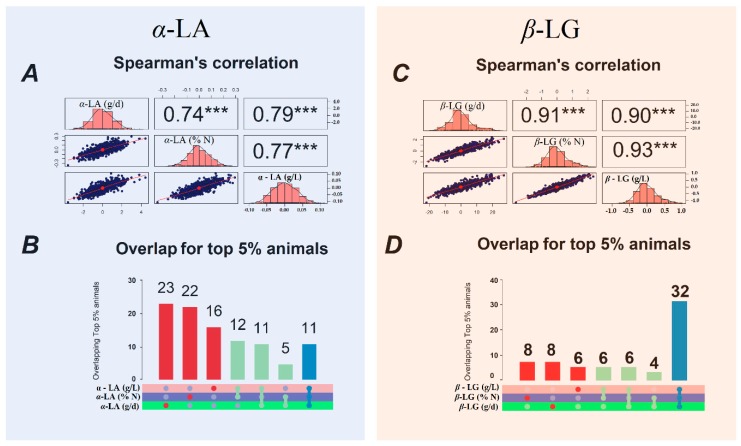
Figure 2.
Genomic breeding value (GEBV) distributions (diagonal), Spearman’s correlations of GEBV (top triangle), and scatter plots (lower triangles) for α-LA (A) and β-LG (C), and the overlap between the 5% of animals (n = 50) with the highest GEBV for α-LA (B), and β-LG (D) contents (g/L), proportions (%N), and daily yields (g/d).

