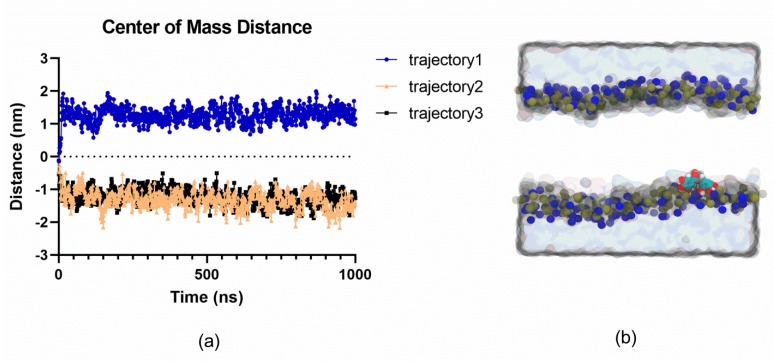
Figure 5.
Molecular dynamics simulations show the preferential localization of EGCG in the headgroup region of a POPC membrane. (a) Localization of EGCG molecules along 1-microsecond simulation runs with respect to the bilayer center (0 nm). (b) Representative snapshot highlighting the preferential localization of the EGCG in the headgroup region of a POPC bilayer (phosphate and nitrogen atoms are shown as blue and brown spheres, respectively, the solution is shown as a grey surface and lipid tails are omitted for clarity. The EGCG molecule is shown as cyan, red, and white spheres).

