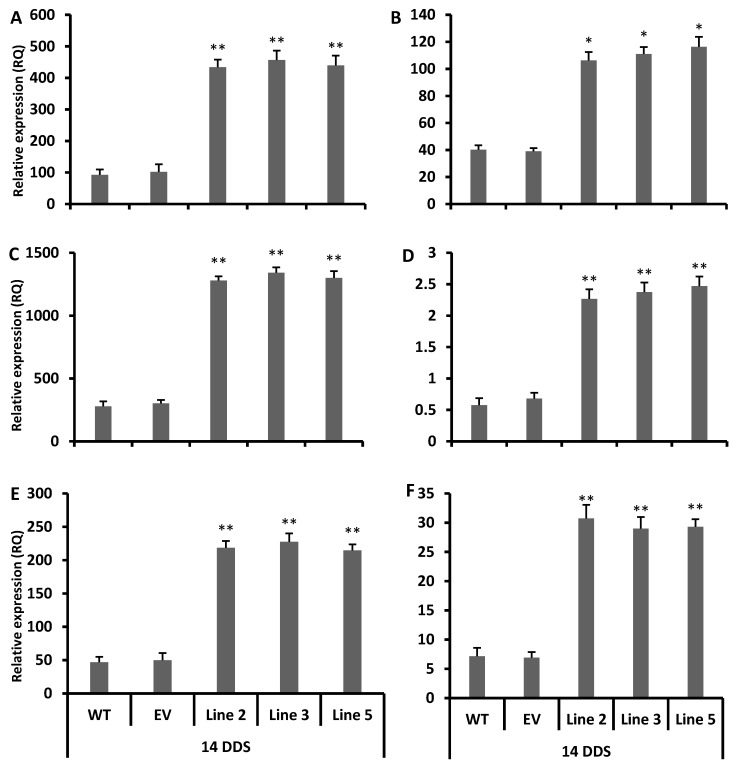
Figure 4.
The q-PCR relative expression data of 6 genes under drought stress: (A) AT5G13930 TT4, (B) AT3G55120 TT5, (C) AT3G51240 TT6, (D) AT5G08640 FLS, (E) AT3G13610 F6′H1, and (F) AT4G22880 TT18. Gene IDs were taken from Arabidopsis genome website TAIR (https://www.arabidopsis.org/). FLS: flavonol synthase. 14DDS: after 14 days of drought stress. WT: wild type. EV: empty vector. A Students t-test was used to compare the CYT-OX and WT plants at * p < 0.05 and ** p < 0.01. Each value is a mean of three replicates.

