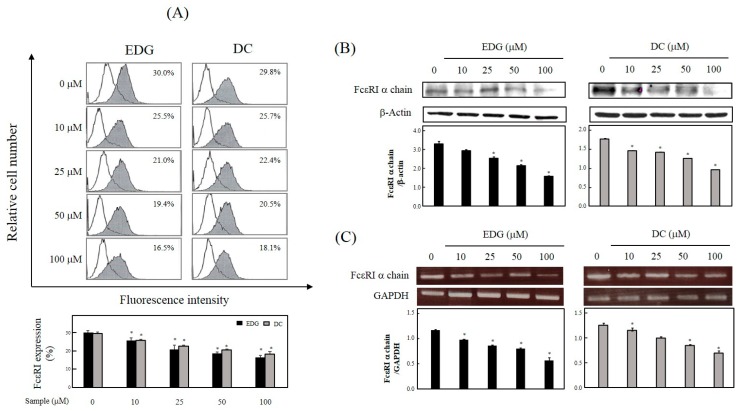
Figure 3.
Effects of EDG and DC on FcεRI expression. KU812F cells were cultured in the presence of different EDG and DC concentrations (0, 10, 25, 50, and 100 μM) for 24 h under serumfree conditions. (A) Flow-cytometry analysis conducted using anti-FcεRI antibody (CRA-1) followed by staining with fluorescein isothiocyanate (FITC)-conjugated Fragment antigen binding, F(ab’)2 goat antimouse immunoglobulins. (B) Western blot analysis conducted using CRA-1 and β-actin. Protein amount in each band was quantified by densitometry. (C) Total RNA was prepared, and FcεRI α chain and internal control, glyceraldehyde 3-phosphate dehydrogenase (GAPDH) were detected by RT-PCR. Each value represents mean ± SD of three different experiments. Relative density calculated as ratio of each protein expression to β-actin and each mRNA level to GAPDH. * Values significantly different from control (* p < 0.05).

