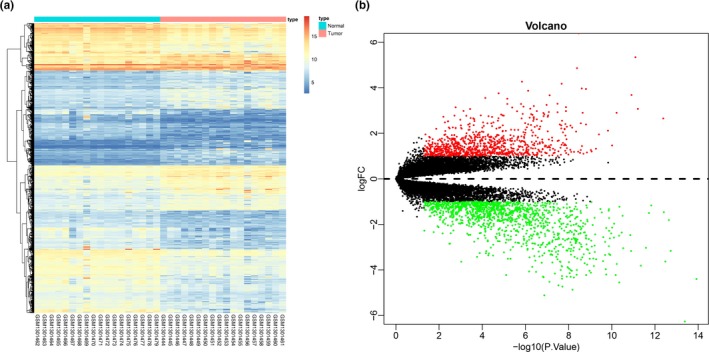
Figure 1.

Analysis of DEGs in data set GSE53819. (a) The expression heatmap of DEGs in NPC. The abscissa represents the sample number, whereas the dendrogram in the left side represents gene expression cluster and the upper right histogram refers to color gradation. (b) The volcano map of DEGs. The abscissa indicates multiple of gene expression, and the ordinate indicates P value. Red dots represent up‐regulated genes in NPC, and green dots represent downregulated genes in NPC. DEG, differentially expressed gene; NPC, nasopharyngeal carcinoma.
