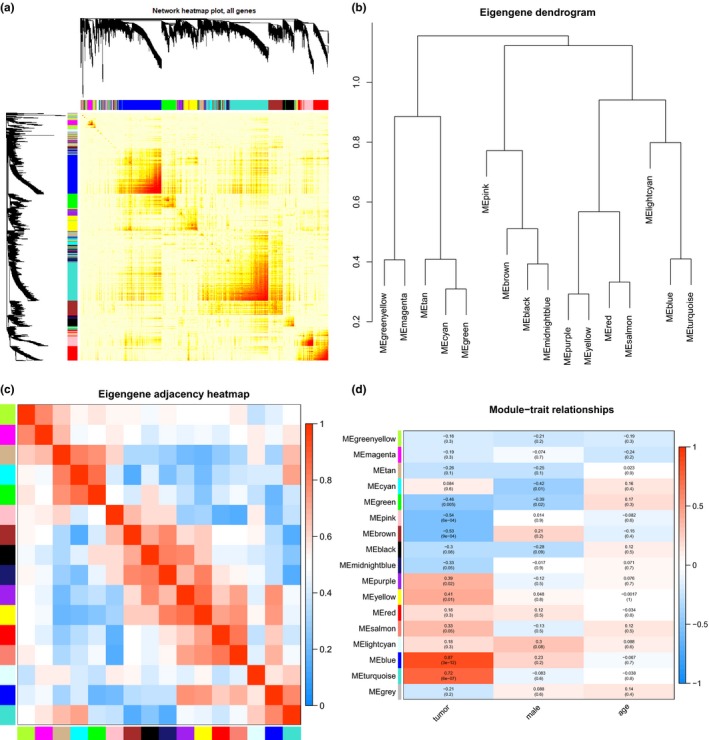
Figure 3.

Correlation analysis of modules. (a) Interaction relationship analysis of co‐expression genes. Different colors of abscissa and ordinate refer to different modules. The brightness of yellow in the middle refers to the degree of connectivity of different modules. No significant difference is found regarding interactions among different modules, which suggests a high level of independence among those modules. (b) Cluster analysis in each module. (c) Correlation analysis in each module. Different colors of the abscissa and the ordinate represent different modules. Each rectangle represents the module correlation value, and the histogram in the right side represents color gradation. (d) The correlation between each module and clinical information. The abscissa refers to clinical information (tumor, sex, and age), and the ordinate refers to different modules. Each rectangle and value point to the correlation value between one module and one clinical information, and histogram in the right side represents color gradation.
