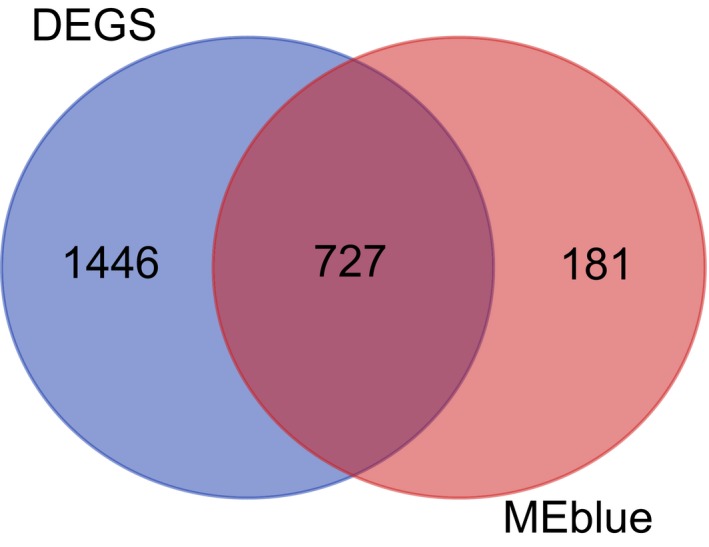
Figure 4.

The intersection of nasopharyngeal carcinoma‐related DEGs and genes from the blue module. The circles in the left side represent DEGs, whereas those in the right side indicate genes from the blue module and the middle part points to their intersection. DEG, differentially expressed gene.
