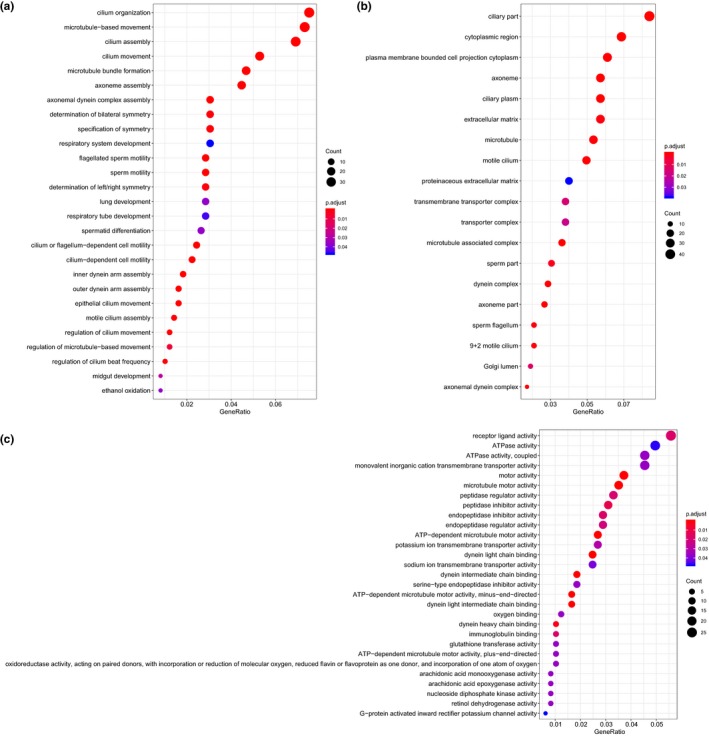
Figure 5.

GO functional enrichment analysis of DEGs in nasopharyngeal carcinoma. (a–c) The enrichment results of biological process, cellular component, and molecular function by GO functional enrichment analysis. The abscissa represents GeneRatio, and the ordinate represents the item name. The histogram in the right side indicates color gradation. GO, gene ontology.
