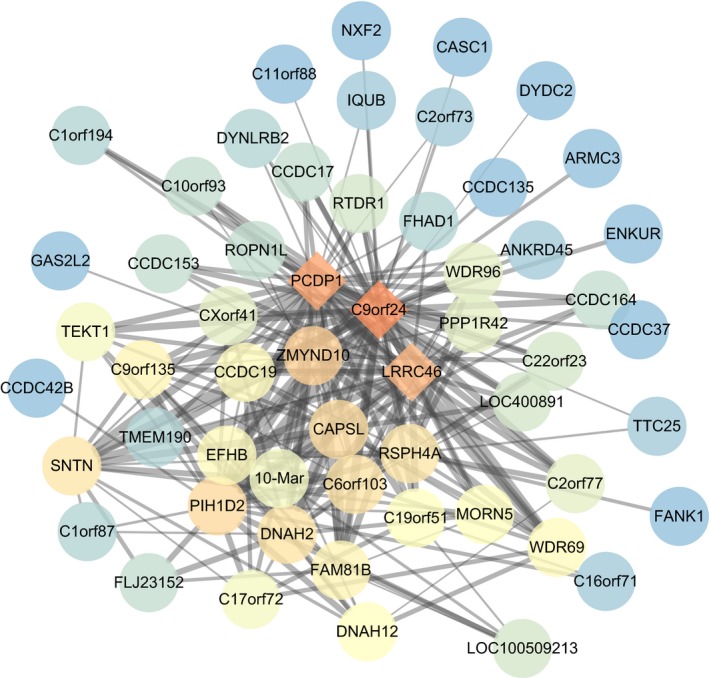
Figure 7.

The PPI network of genes with a weight value > 0.45 in the blue module. Each circle represents a gene. Different colors indicate the core degree of genes in the PPI network, whereas darker color refers to higher core degree. The lines among genes represent the weight value between two gene, whereas bolder lines indicate higher weight value. PPI, protein‐protein interaction.
