Table 2.
IC50 values of β-lapachone and derivatives in different study models.
| Compound | 2D Structure | IC50 | Study Model | References |
|---|---|---|---|---|
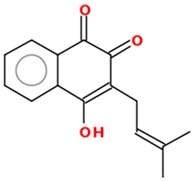
| Lapachol |
|
16.04–72.3 µM | Human chronic myelogenous leukemia (K562, Lucena), Burkitt’s lymphoma (Daudi), Breast cancer (MCF-7, SK-BR3) | [110,111] |
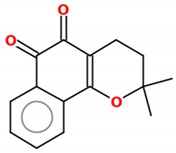
| ß-lapachone |
|
0.03–70.13 µM | Lung cancer cells (A549 cell line); Tongue squamous cell carcinoma (HSC-3, SCC4, SCC9, SCC15, SCC25), hepatocellular carcinoma (HEPG2), HL-60, K562, Gastric adenocarcinoma (AGP-01, ACP-02, ACP-03), colon adenocarcinoma (HT-29, HCT-116). | [112,113] |
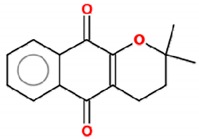
| α-lapachone |
|
38–69 µM | K562, Lucena, Daudi, MCF-7 | [111] |
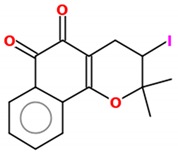
| 3-iodo-ß-lapachone |
|
0.02–5.61 µM | Tongue squamous cell carcinoma (HSC-3, SCC4, SCC9, SCC15, SCC25), hepatocellular carcinoma (HEPG2), HL-60, K562, Gastric adenocarcinoma (AGP-01, ACP-02, ACP-03), colon adenocarcinoma (HT-29, HCT-116). | [113] |
| 3-I-α-lapachone |
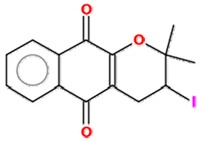
|
0.77–14.65 µM | ||
| naphtho[2,1-d]oxazole-4,5-diones |
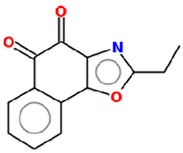
|
4.6–20 µM * | Lung cancer cells (A549 cell line) | [112] |
* IC50 values range for all derivatives shown in reference [112].
