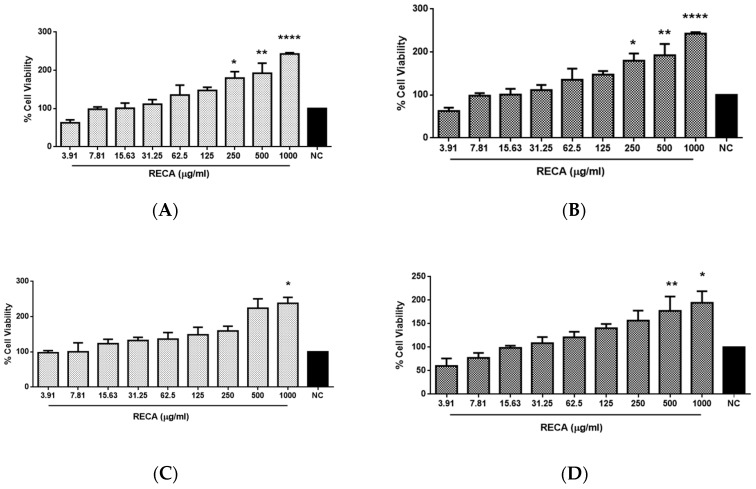
Figure 2.
Cytotoxicity effect of RECA against SH-SY5Y (A,B) and RAW 264.7 (C,D) cell lines after 24 h (A,C) and 48 h (B,D) of exposure using MTT assay at the concentration ranging from 3.91 to 1000 μg/mL. NC = negative control (untreated cells). Results are expressed as the mean ± SEM in triplicate. * p ≤ 0.05, ** p ≤ 0.01, and **** p ≤ 0.0001 compared to NC denoted as 100%.

