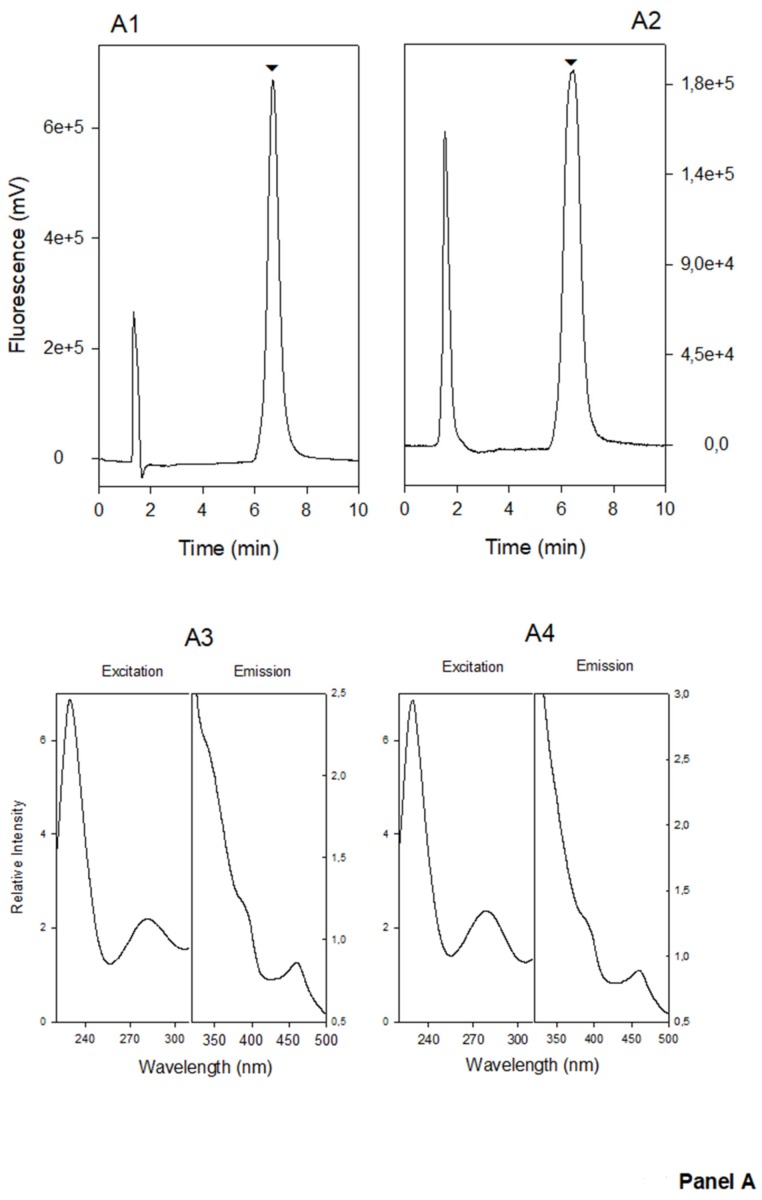
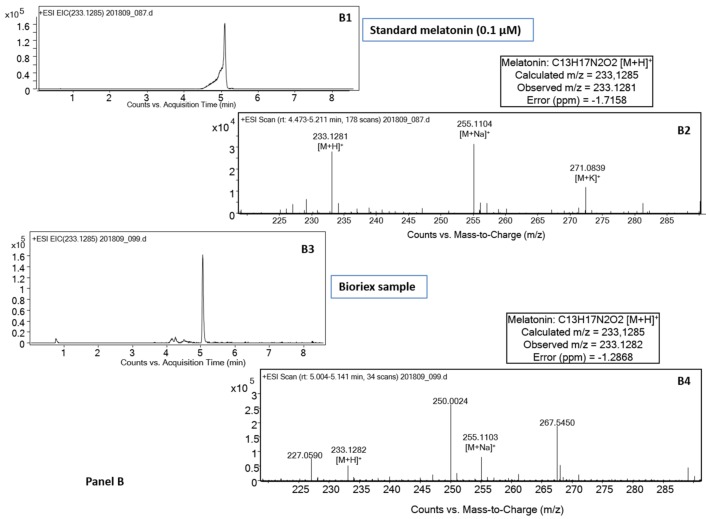
Figure 2.
Panel A. Representative chromatograms of standard melatonin (A1) and Bioriex sample (A2) with liquid chromatography and fluorescence detection. Fluorescence detection was programmed at λexc of 280 nm and λemi of 350 nm. The melatonin peak has a retention time of 6.5 min. The excitation spectrum was measured with emission at 350 nm and the emission spectrum with excitation at 280 nm, using an in-line spectral analysis (stopped-flow) in standard melatonin (A3) and Bioriex sample (A4). Panel B. Representative chromatograms and mass spectra of standard melatonin, HM and Bioriex samples using liquid chromatography with time-of-flight/mass spectrometry (LC-QTOF/MS). (B1): Extracted ion chromatogram (EIC) at m/z 233.13000 of a standard solution of melatonin. (B2): Accurate mass spectra of standard melatonin solution showing different derivates of the base peak ion with the mass data analysis of protonated [M + H]+. (B3): EIC as in B1 of Bioriex sample. (B4): Protonated base peak ion of melatonin in Bioriex sample and their corresponding accurate mass analysis.


