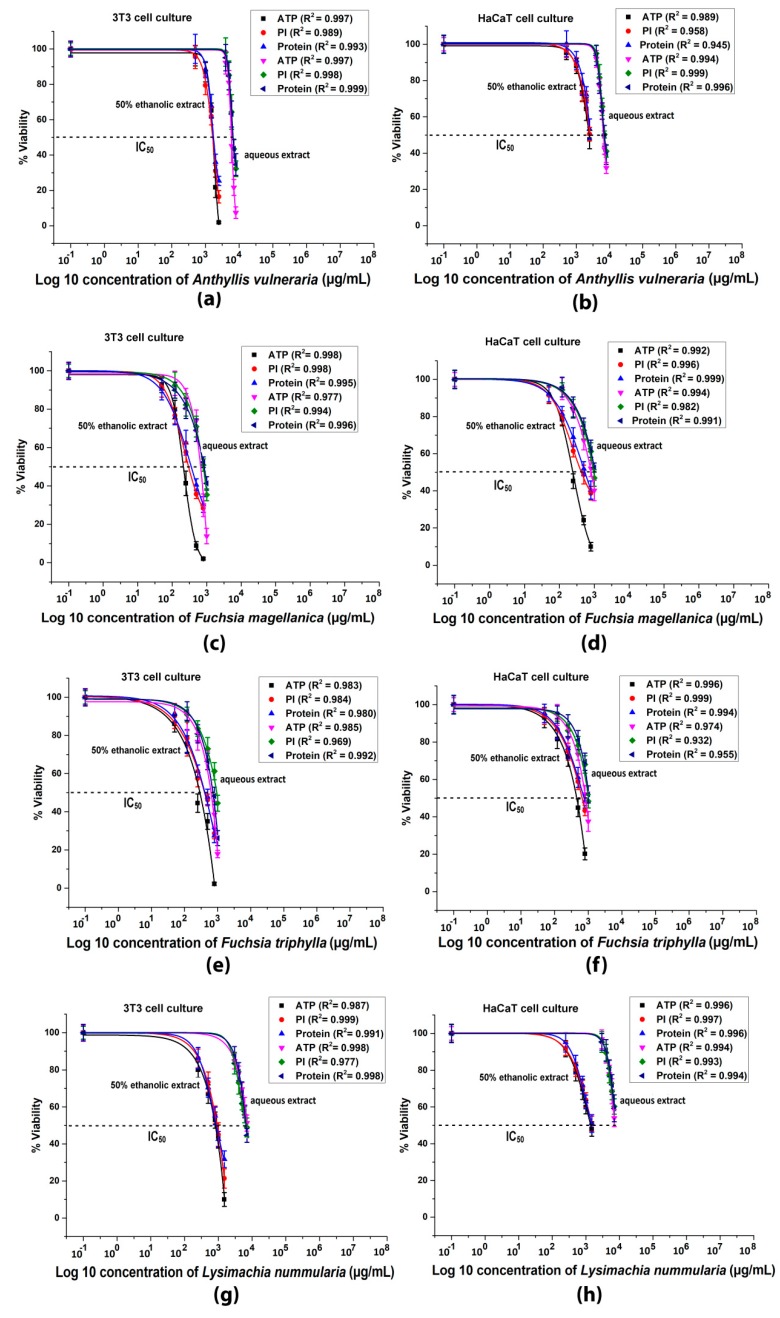
Figure 5.
Intracellular ATP content, cell number (PI) and total protein levels of 3T3 and HaCaT cells with dose-response fitting: (a,b) cytotoxic effects of A. vulnearia on 3T3 and HaCaT cells; (c, d) cytotoxic effects of F. magellanica on 3T3 and HaCaT cells; (e,f) cytotoxic effects of F. triphylla on 3T3 and HaCaT cells; (g,h) cytotoxic effects of L. nummularia on 3T3 and HaCaT cells. Data are expressed in % of the control. Mean ± SD of 5 independent experiments, n = 5 × 8 replicates for each concentration. Dose-response curves were created by log10 transformation and nonlinear curve fitting. Correlation coefficients (R2) were calculated for each treatment.

