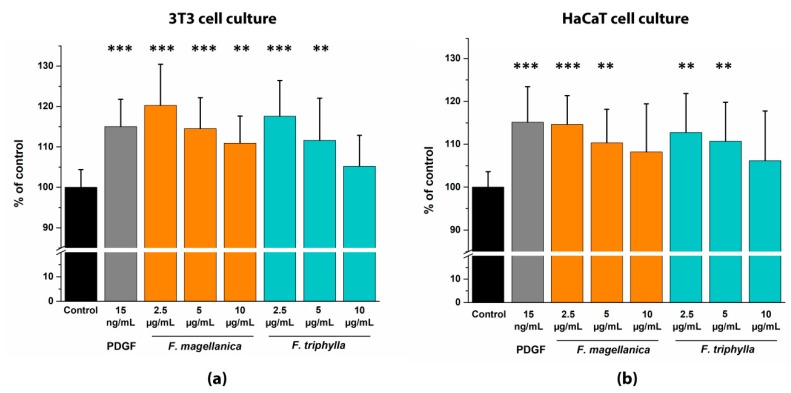
Figure 7.
Comparative analysis by time-lapse imaging of wound closure ability of PDGF-BB and plant extracts on HaCaT monolayer. (a) 50% (v/v) ethanolic extracts of F. magellanica and F. triphylla on 3T3 monolayer cells; (b) 50% (v/v) ethanolic extracts of F. magellanica and F. triphylla on HaCaT monolayer cultures. Cells were monitored for 24 h in the absence and in the presence of plant extracts or PDGF with phase contrast microscopy. The bar graphs of AUC were calculated from cumulative closure rates (CR %) studied at every 4 h with three different concentrations from each plant. Mean ± SD of three independent experiments. n = 3 × 3 replicates. One-way Anova test (** p < 0.01, *** p < 0.001 compared with control).

