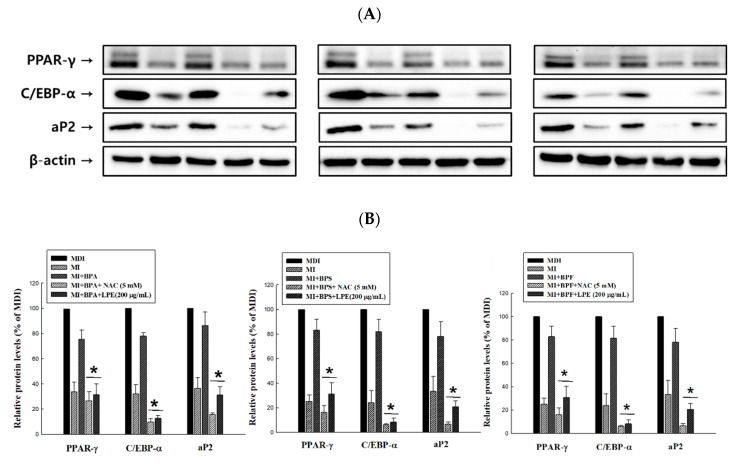
Figure 5.
Effects of LPE on the protein expressions of BPA-, BPS-, and BPF-induced adipogenic transcription factors (PPAR-γ: 53, 57kDa, C/EBP-α: 42 kDa and aP2: 15kDa) in 3T3-L1 adipocytes. (A) Total protein was obtained using a lysis buffer and quantified by loading, transfer, blocking, and appropriate antibody reactions. (B) Expression levels of adipogenic transcription factors were densitometrically normalized to those of β-actin and compared to the MDI control group as a percentage in each antibody. All values are presented as the mean ± SD. * p < 0.05 VS. BPA, BPS, or BPF treatment group, according to one-way analysis of variance.

