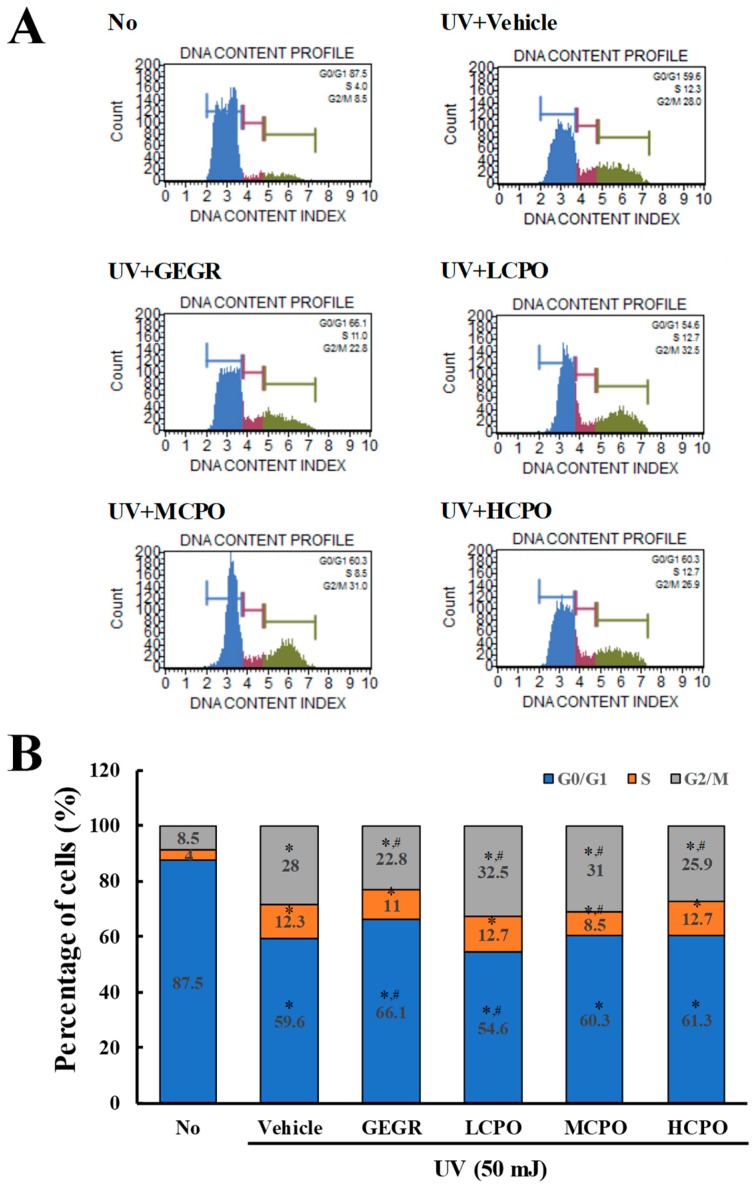
Figure 5.
Cell cycle analysis after UV + CPO treatment. (A) Cell cycle histograms obtained using flow cytometry. Cell cycle distributions were determined by flow cytometric analysis of propidium iodide (PI) stained NHDF nuclei. (B) Percentage of cell numbers in each cell cycle. Numbers of cells in the G0/G1, S, and G2/M stages were determined after UV + CPO treatments. Two to three wells per group were PI stained and cell numbers in each phase were measured in duplicate. Data are reported as the means ± SD. * p < 0.05 compared to the No group. # p < 0.05 compared to the UV + Vehicle group. Abbreviations: LCPO, low concentration CPO; MCPO, medium concentration CPO; HCPO, high concentration CPO; GEGR, gallotannin-enriched extract of Galla rhois.

