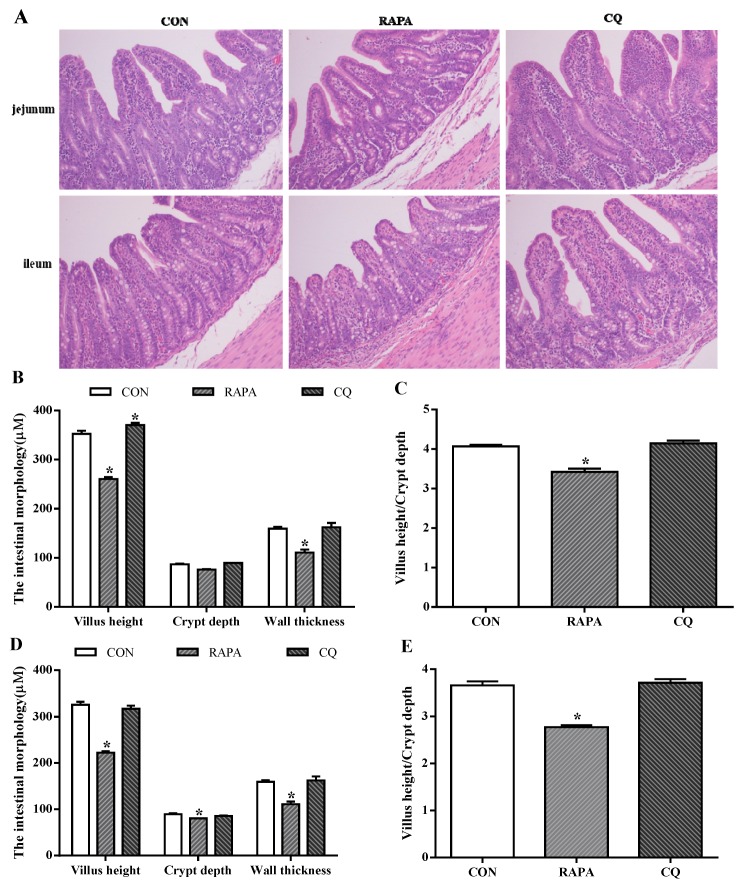
Figure 2.
Morphology analysis. (A) Sections were stained with hematoxylin and eosin (H and E). (B) Jejunum morphology. (C) Ratio of villus height to crypt depth in jejunum. (D) Ileum morphology. (E) Ratio of villus height to crypt depth in ileum. Dietary treatment: RAPA, rapamycin; CQ, chloroquine; CON, normal saline. Data are expressed as means ± SEM (n = 6), all values are expressed in relation to the control. * p < 0.05 vs. control.

