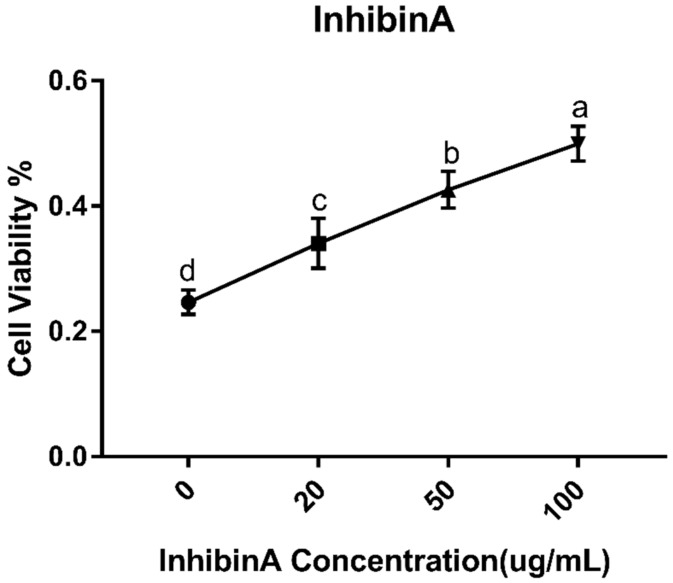
Figure 3.
MTT assay of GCs cultured under different doses of inhibin A (20, 50, and 100 µg/mL) and the corresponding control (0 µg/mL). The measured cell counts for percent viability are indicated on the Y axis, and the doses of inhibin A are indicated on the X axis. Values are expressed as mean ± SEM of n = 3. The bars labeled with completely different letters indicate a significant difference, p < 0.05.

