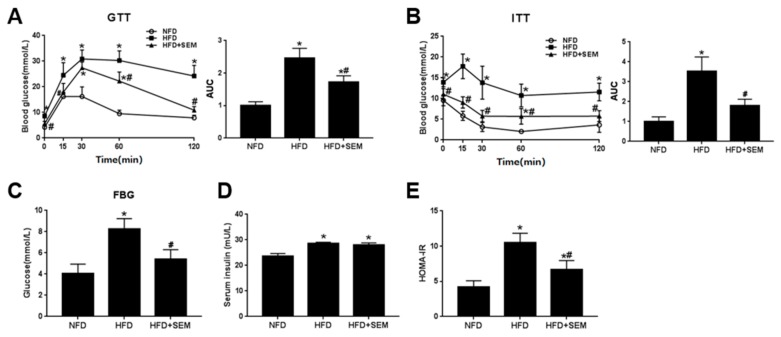
Figure 2.
SEM improves insulin sensitivity in HFD-induced obese mice. (A) Glucose tolerance test (GTT) curve and area under the curve (AUC). (B) Insulin tolerance test (ITT) curve and AUC. (C) Fasting blood glucose levels. (D) Serum insulin levels. (E) Homeostasis model assessment of insulin resistance (HOMA-IR) levels. All values are presented as mean ± SD (n = 5). * p < 0.05 versus the NFD group; # p < 0.05 versus the HFD group.

