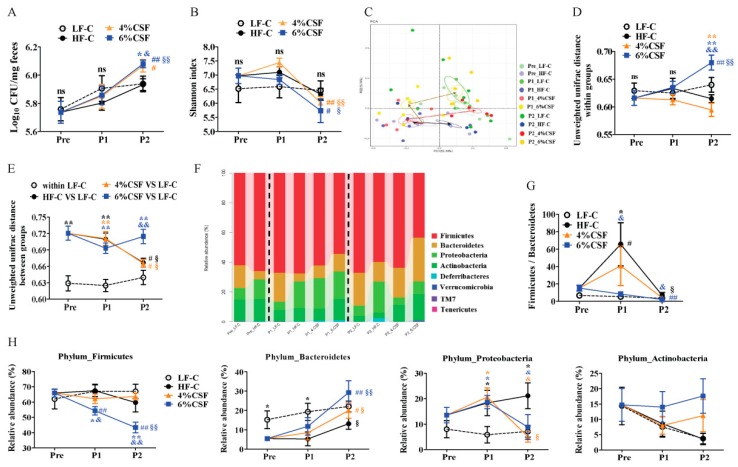
Figure 4.
CSF alters the gut microbiota composition. (A) Total bacteria load (n = 7). (B) The alpha diversity of feces microbiota as a function of time (n = 5–7). (C) The principal component analysis (PCA) of feces microbiota (n = 5–7). The circle shows a 10% confidence interval (CI). (D,E) The unweighted unifrac distance within (D) and between (E) groups calculated at the operational taxonomic unit (OTU) level across individual microbiota. (F) The changes in bacterial abundance at the phylum level. (G) The Firmicutes/Bacteroidetes ratio in different groups. (H) The changes in relative abundance of Firmicutes, Bacteroidetes, Proteobacteria and Actinobacteria. Data are expressed as mean ± SEM. Statistical significance was assessed by Tukey’s test for multiple comparisons. *, ** p < 0.05 and 0.01 respectively compared with the LF-C group. & and && indicate p < 0.05 and 0.01, respectively, compared with the HF-C group. # and ## indicate p < 0.05 and 0.01, respectively, compared with the pre-treatment group. § and §§ inicate p < 0.05 and 0.01, respectively, compared with the treatment period 1. ns —not significant, p > 0.05. The black, orange, and blue symbols represent the statistical analysis of HF-C, 4% CSF, or 6% CSF groups, respectively, with other groups or the same group at different time points.

