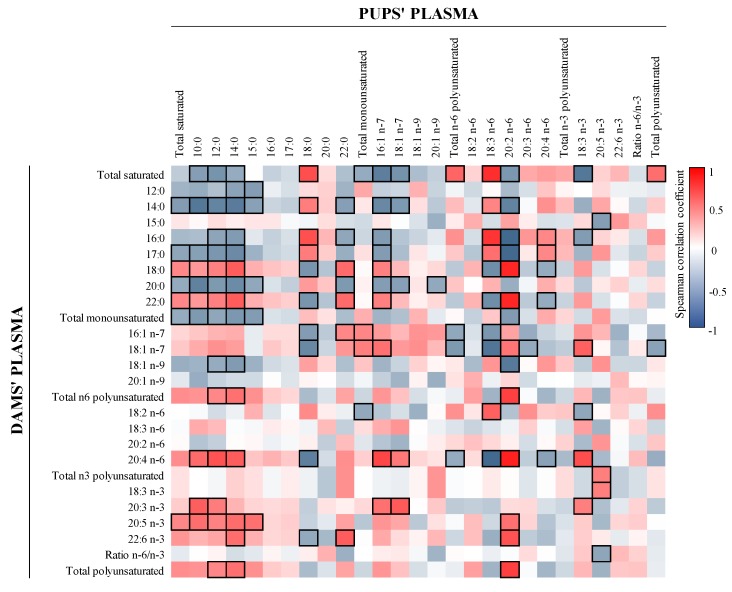
Figure 2.
Correlations between dams’ and pups’ FA plasma content. The Spearman correlation coefficient is represented in the heat map following the color in the legends. Correlations with statistical significance (p < 0.05) are shown in a bold frame. Results derived from n = 6 for milk and dams’ plasma and n = 24 for pups’ plasma.

