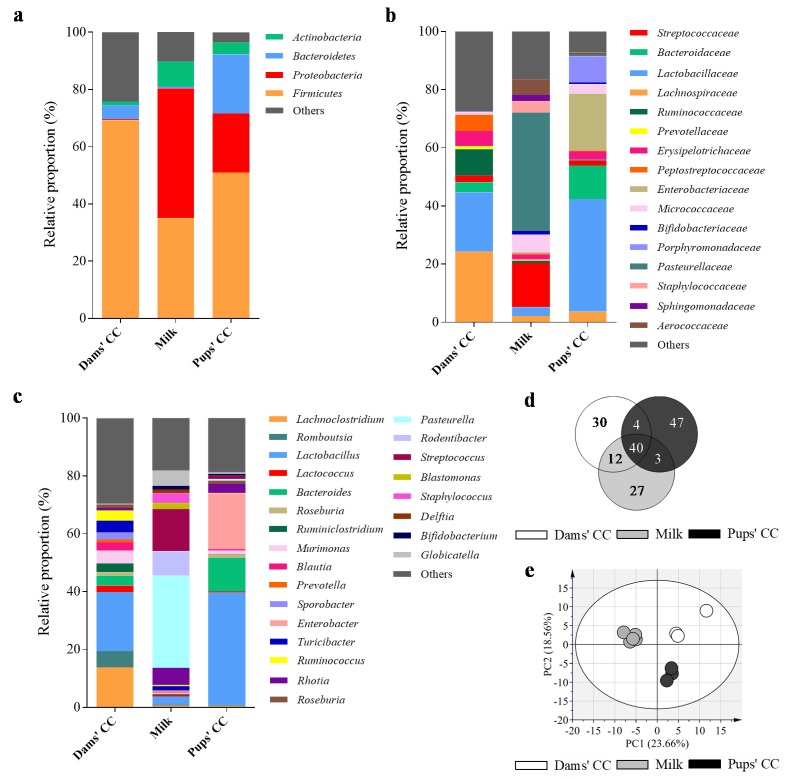
Figure 4.
Assessment of microbiota composition of milk (n = 6) and CC (n = 3). The sequencing of the amplicon targeting the V3–V4 region of the 16S rRNA was performed following the 16S Metagenomic Sequencing Library Illumina 15044223 B protocol. The main taxonomic ranks abundances, corresponding to (a) phylum, (b) family, and (c) genera are represented in stacked bars. The qualitative assessment of microbiota was represented (d) in a Venn Diagram at the level of genera. Finally, the natural clustering of samples was assessed (e) by Principal Component Analysis (PCA) at the level of genera. Results derived from n = 5 for milk and n = 3 for both dams’ and pups’ CC. Cecal content (CC).

