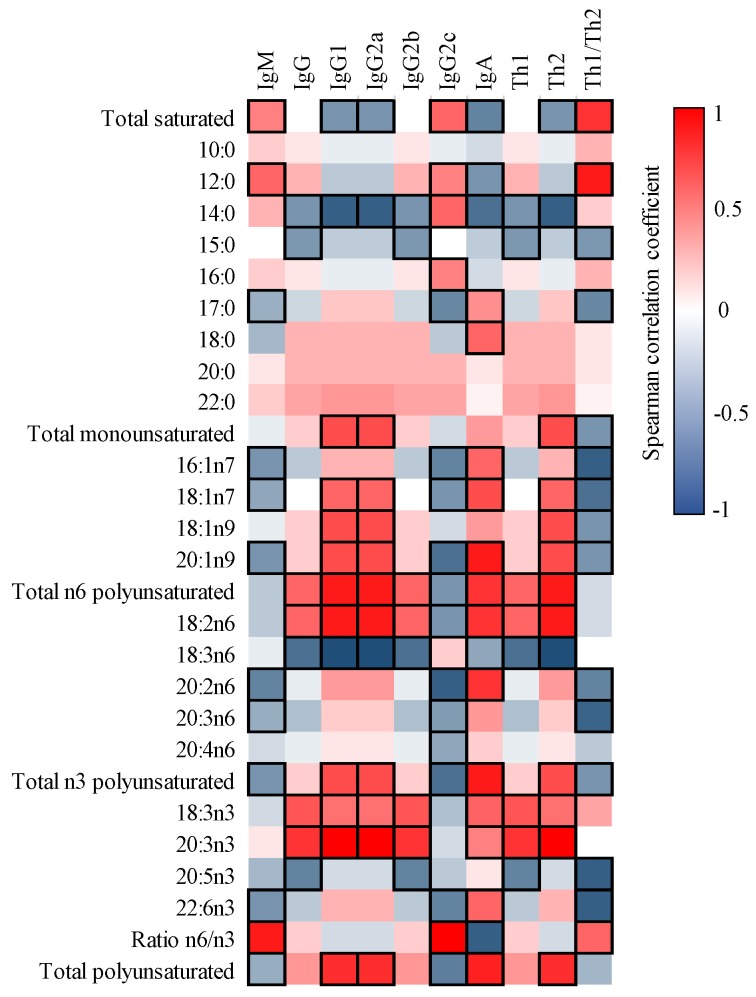
Figure 5.
Correlation between the FA composition and Ig present in milk. The Spearman correlation coefficient is represented in the heat map following the color in the legend. Correlations with statistical significance (p < 0.05) are shown in a bold frame. Results derived from n = 6 for both milk and dams’ plasma.

