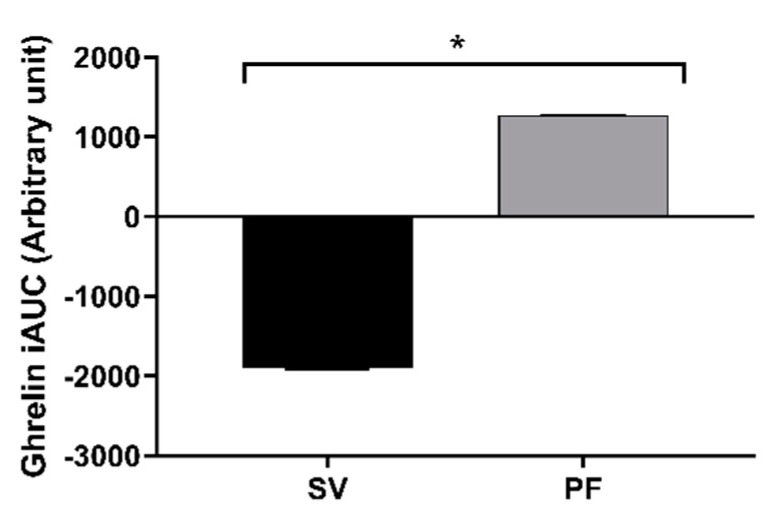
Figure 4.
The baseline adjusted area under the curve (iAUC0-240) of the circulatory active ghrelin hormone in response to the two treatment arms, PF: pan-fried and SV: sous-vide. The values are presented as mean ± SEM. Comparisons between the two cooking methods were conducted using a paired t-test. * The values differed significantly between the cooking methods (p = 0.006).

