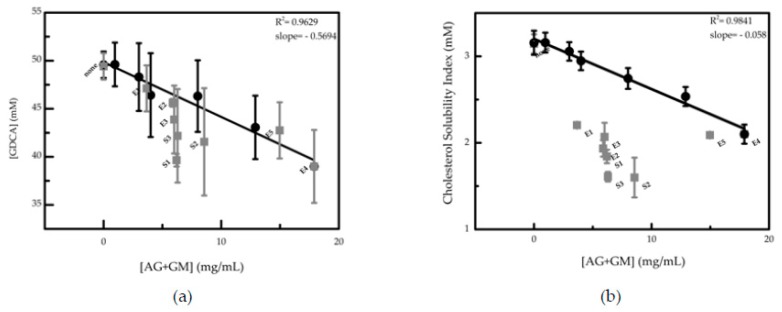
Figure 4.
(a) Bile salt concentration and (b) cholesterol solubility index dependence on the total concentration of coffee galactomannans and arabinogalactans (filled black circles and linear fit). Coffee samples (S1–S3) and extracts (E1–E5) are represented as solid gray squares. The standard deviations presented correspond to at least three independent experiments.

