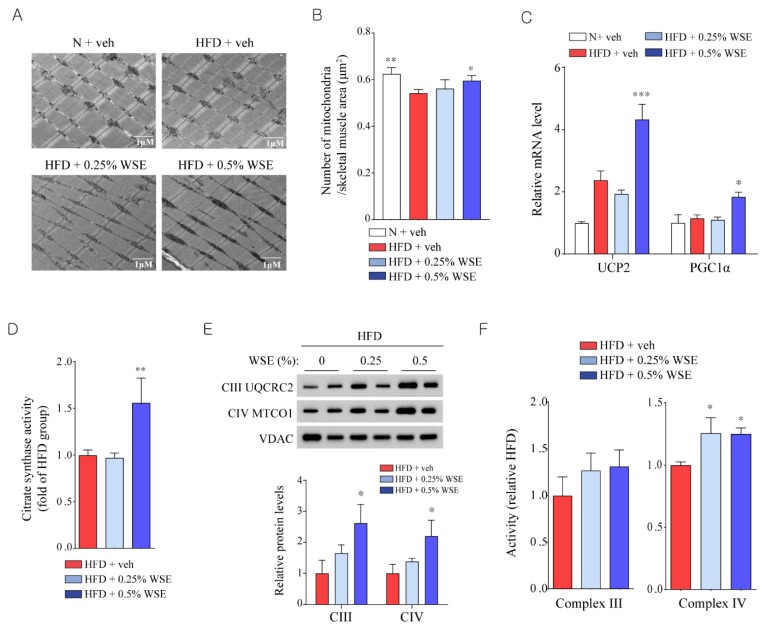
Figure 3.
WSE improves mitochondrial function in skeletal muscle. (A) Representative transmission electron microscopic images of the skeletal muscle. (B) Number of mitochondria per skeletal muscle area. (C) Relative mRNA levels of mitochondrial-related genes in skeletal muscle. (D) Citrate synthase activity in skeletal muscle. (E) Expression of protein involved in mitochondrial complexes III and IV in skeletal muscle, and densitometry-based quantification of the data, normalized to the level of VDAC (n = 3). (F) Activity of mitochondrial complexes III and IV in skeletal muscle. Data represent the mean ± SEM (n = 5). Difference between groups was evaluated by Tukey’s multiple comparison test. * p < 0.05; ** p < 0.01; *** p < 0.001 compared with the HFD group.

