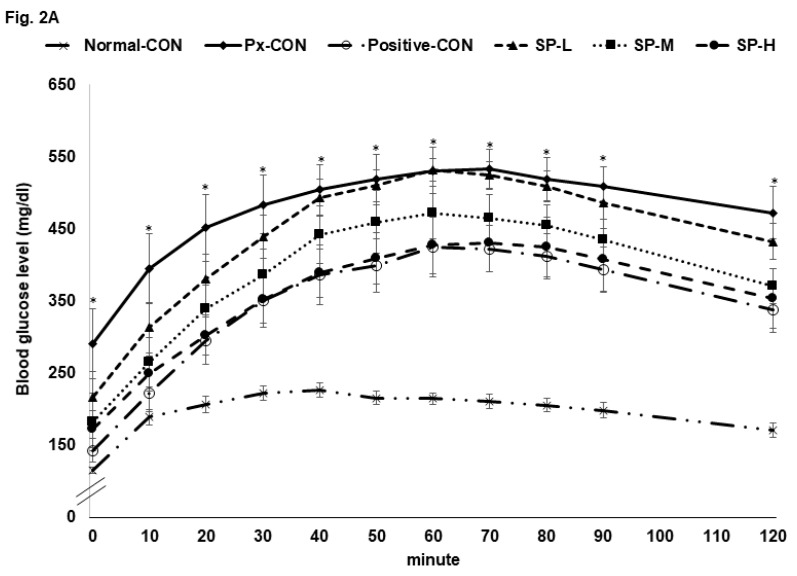
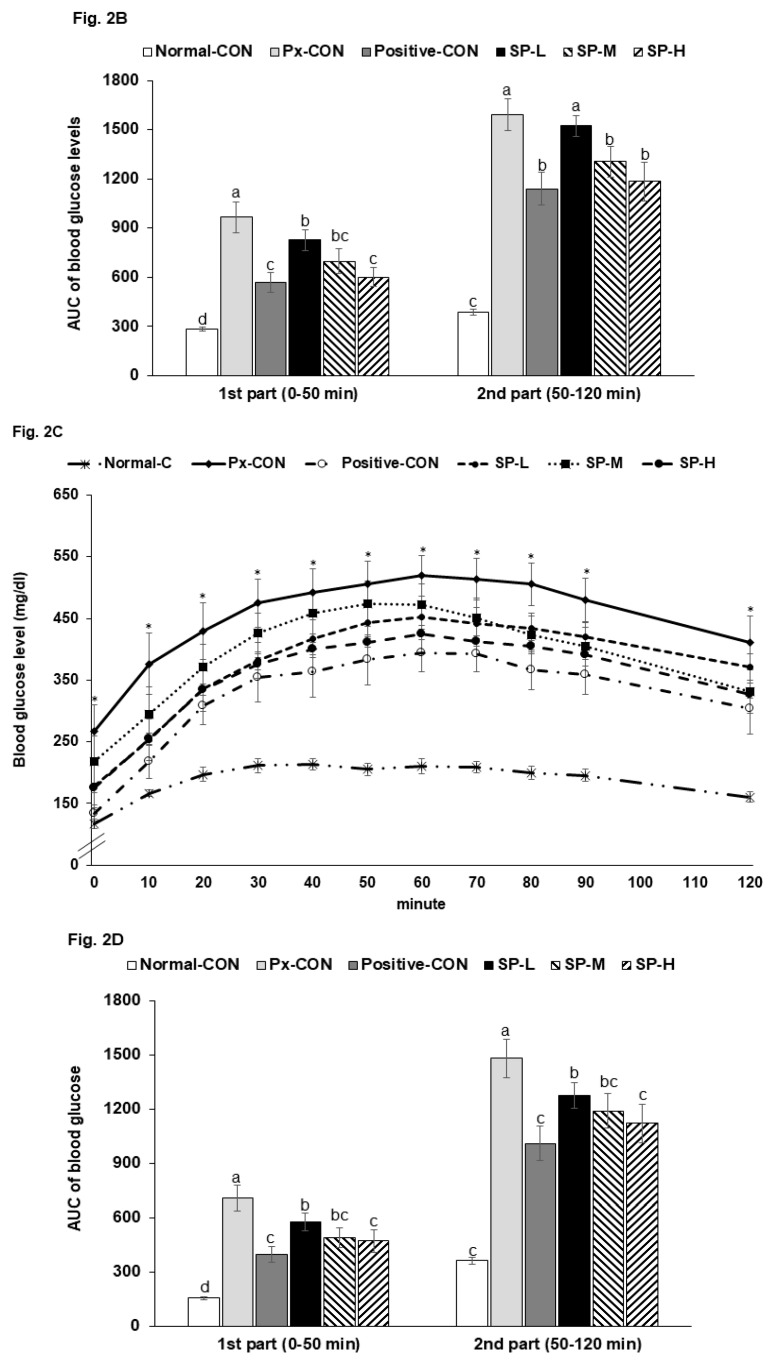
Figure 2.
Serum glucose levels during oral glucose tolerance test (OGTT) and oral maltose tolerance test (OMTT) after a 16 h fast. (A). Changes in serum glucose concentrations after an oral challenge of 2 g glucose/kg. (B). Areas under the curve (AUC) for serum glucose during the first (0–40 min) and second phases (40–120 min) of OGTT. (C). Changes in serum glucose concentrations after an oral challenge with 2 g maltose/kg. (D). Areas under the curve (AUC) for serum glucose during the first (0–40 min) and second phases (40–120 min) of OMTT. Bars or dots and error bars represent means ± SDs (n = 10). * indicates a significant intergroup difference (p < 0.05). a,b,c Different letters on bars indicate significant differences (p < 0.05).


