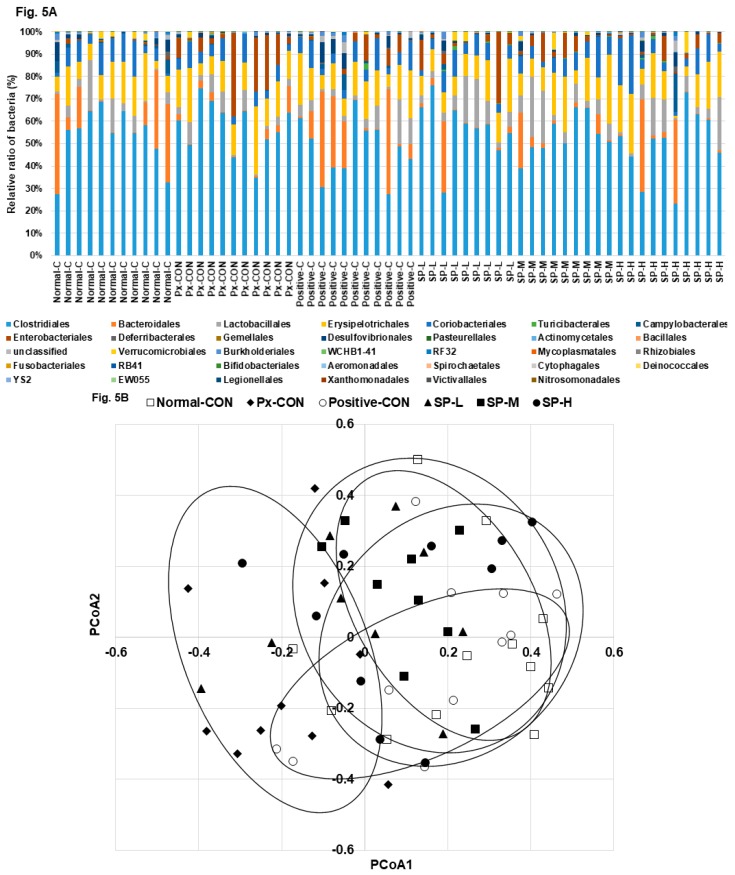
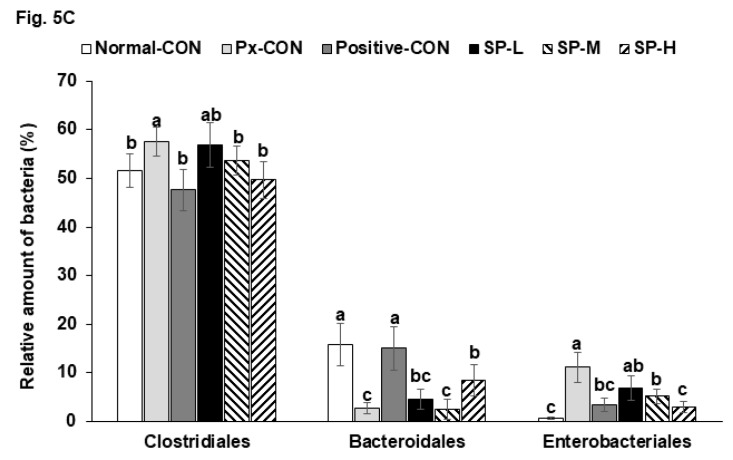
Figure 5.
Gut microbiome and area. (A). The composition of gut microbiome in the order level. (B). The PCoA analysis. (C). Relative counts of Bacteroidales, Clostidales, and Enterobacteriales based on total bacteria counts. Dots and error bars represent means ± SD (n = 8). a,b,c Different letters on bars indicate significant differences (p < 0.05).


