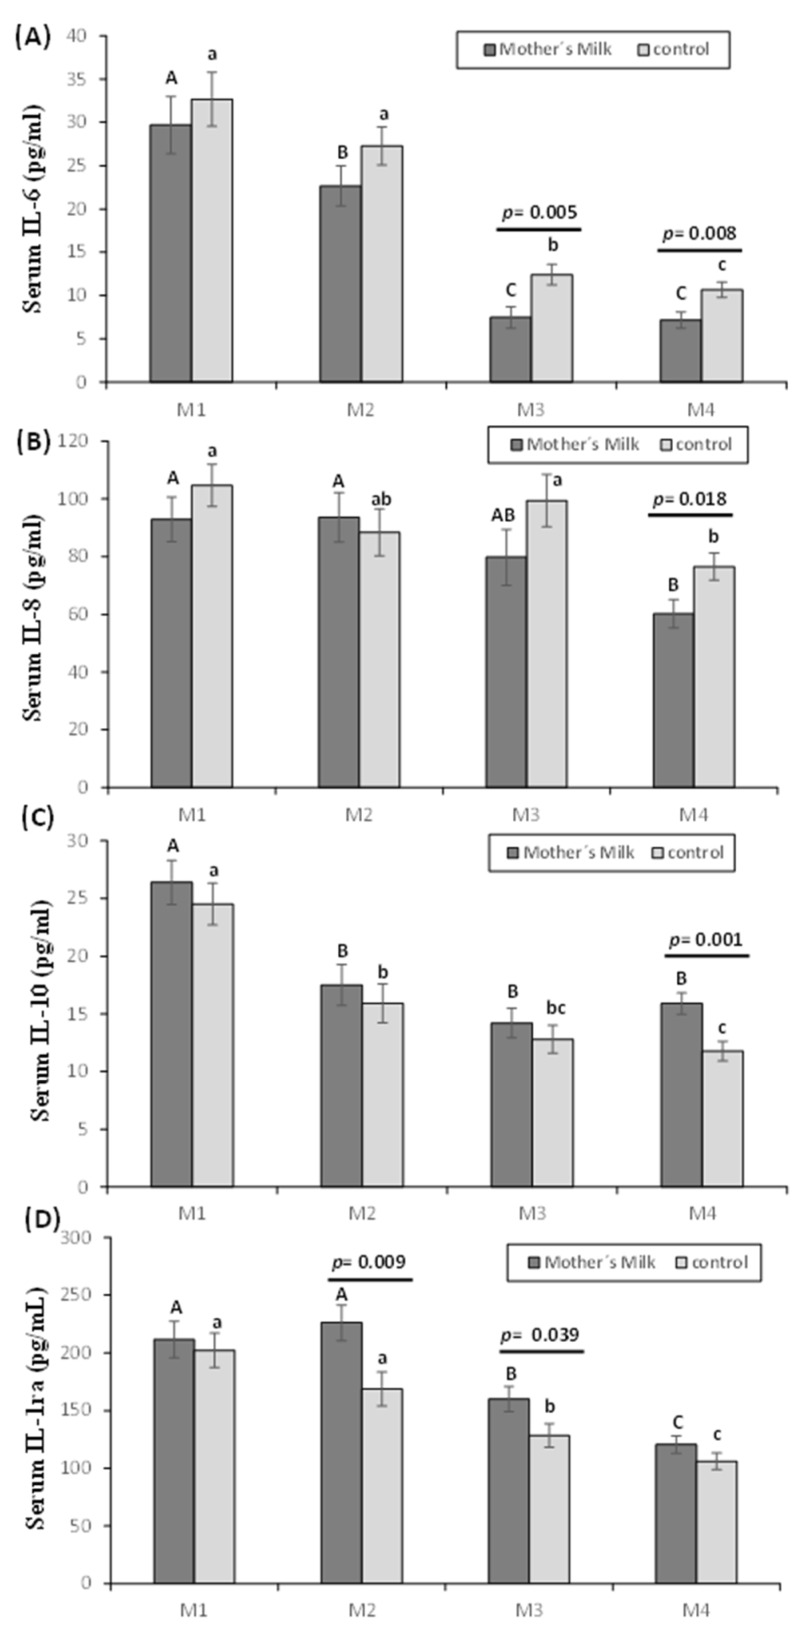
Figure 2.
Effect of oropharyngeal mother’s milk administration on the levels of IL-6 (A), IL-8 (B), IL-10 (C), and IL1-ra (D) in serum. Results are expressed as mean ± standard error of the mean. A line between bars means statistically significant differences between groups (p < 0.05). Different letters in every group indicate significant differences due to the time (mother’s milk (A, B, C), control (a, b, c) (p < 0.05)). M1: Birth (basal value), M2: 3rd day of postnatal life; M3: 15th day of postnatal life, M4: 30th day of postnatal life.

