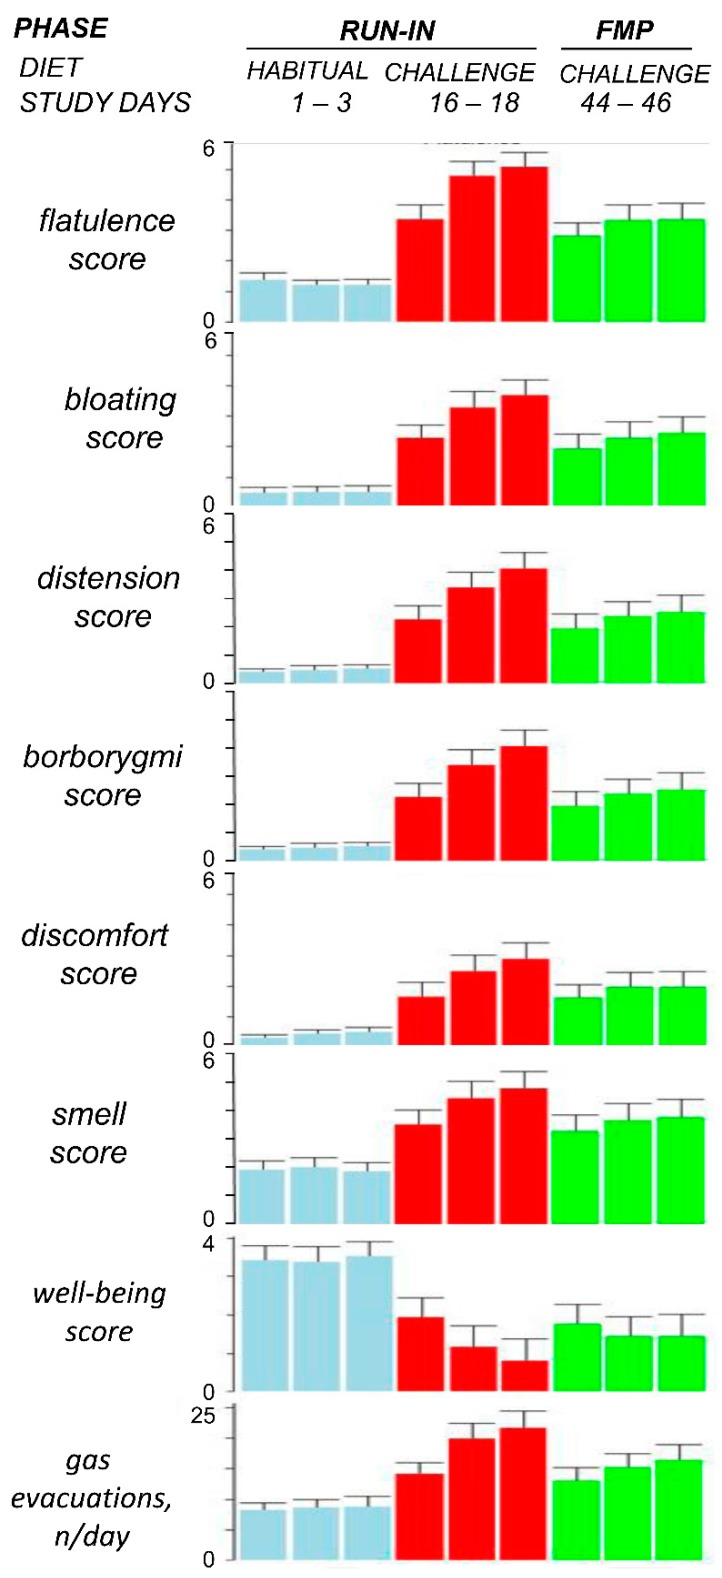
Figure 3.
Tolerance of the flatulogenic diet. FMP: fermented milk product administration phase. To show daily variability, data of the 3 days of each evaluation period are represented; note similar values on days 2 and 3 within each period. Statistical comparisons were performed by Wilcoxon signed rank test using the average of days 2 and 3 of each period: p < 0.0001 for all parameters habitual diet vs. challenge diet during run-in phase (n = 74); p < 0.0001 for all parameters challenge diet during run-in phase vs. challenge diet during FMP administration phase (n = 66) except for abdominal discomfort/pain and digestive well-being (p < 0.05).

