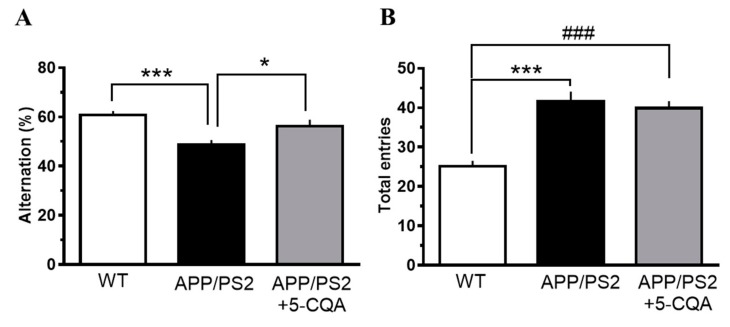
Figure 2.
Spatial recognition memory in the Y-maze test. (A) percentage alteration. (B) total number of maze entries. Mice received experimental diets for 16–17 wk prior to measurements. Data are means ± SEM (n = 16–18 mice/treatment). *: p < 0.05, ***: p < 0.001 vs. APP/PS2, ###: p < 0.001 vs. WT (Bonferroni’s post-hoc test).

