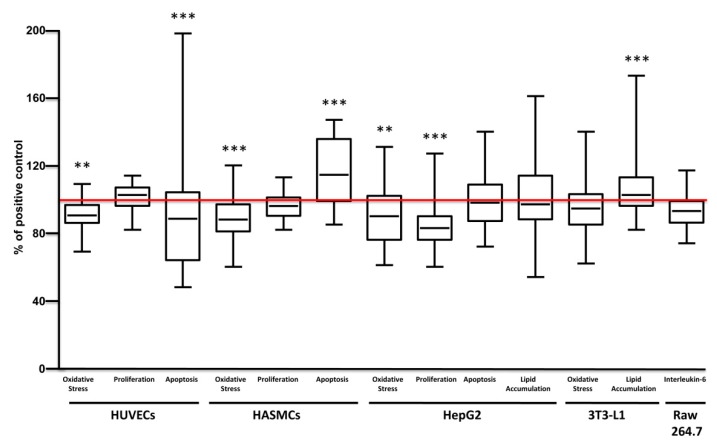
Figure 4.
Global bioactivity of carrot extracts on cell models. Each box and whisker plot represent the effect of carrot extracts in the indicated process (Oxidative stress, cell proliferation, cell apoptosis, lipid accumulation, interleukin-6 production) and cell type (HUVECs, HASMCs, HepG2, 3T3-L1, Raw 264.7) independently from solvent, concentration, variety and growing condition. Results were expressed as percentage of positive control (red line). Statistical analyses were performed by one-way ANOVA and Bonferroni post hoc test, ** p < 0.01, *** p < 0.001 vs control.

