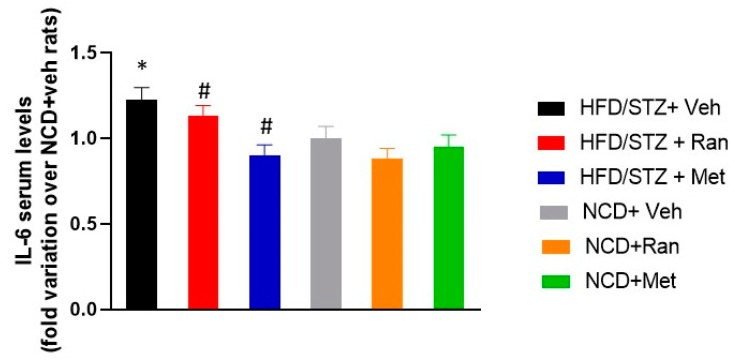
Figure 4.
IL-6 serum levels in each experimental group. Data values are mean ± SD and are expressed as fold variation over NCD + Vehicle rats. * p < 0.05 significantly different from NCD + Vehicle group. # p<0.05 significantly different from HFD/STZ + Vehicle group by two-way ANOVA with Tukey’ s post hoc test. HFD = High fat diet; NCD = Normocaloric diet; STZ = Streptozotocin; Veh = Vehicle; Ran = Ranolazine; Met = Metformin.

