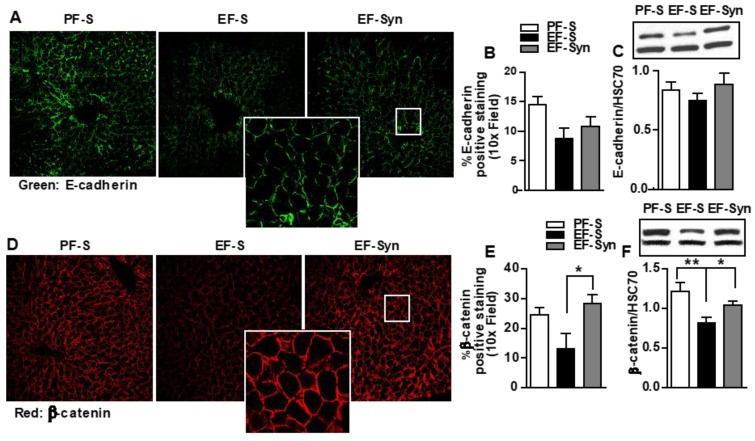
Figure 2.
Cellular junctional proteins in mouse liver. Mice were treated as described in Figure 1. Liver sections that were flash frozen for immunoblotting or fixed in formalin and paraffin embedded for immunohistochemical analysis were probed for the following: (A–C) E-cadherin (green); and (D–F) β-catenin (red). All images were acquired using a 10x objective, and a selected area was cropped and enlarged. Images are representative of at least replicate images captured per mouse in 8 to 12 mice per treatment group. Immunofluorescent images were semi-quantified, and immunoblot band densities were analyzed using ImageJ software and normalized to HSC70. Values represent means ± SEM. * p < 0.05; ** p < 0.001. Pair-fed saline (PF-S); Ethanol-fed saline (EF-S); Ethanol-fed synbiotic (EF-Syn).

