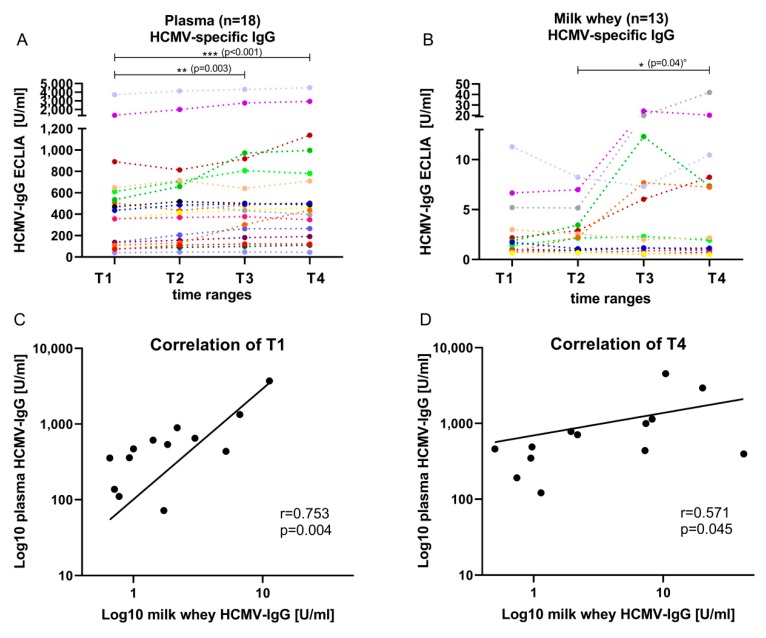
Figure 2.
HCMV-specific-IgG ECLIA values (mean + 95%CI) of 18 seropositive mothers of the BlooMil study in (A) plasma and (B) milk whey from T1 (10 to 15 days pp), T2 (25 to 30 days pp), T3 (40 to 45 days pp) and T4 (55 to 60 days pp). The Friedman test was used for the kinetics and showed a significant change in plasma from T1 to T4 p < 0.001 and T1 to T3 p = 0.003, but in whey, no significant change was detected. °The Wilcoxon matched-pairs signed rank test was used in whey to compare single time ranges; no correction was used. Individual color identification as in Figure 1. Correlation of plasma and milk whey HCMV-specific-IgG were determined by Spearman’s rank correlation and non-linear regression at (C) T1 with r = 0.75, p = 0.004 and (D) T4 with r = 0.57, p = 0.045.

