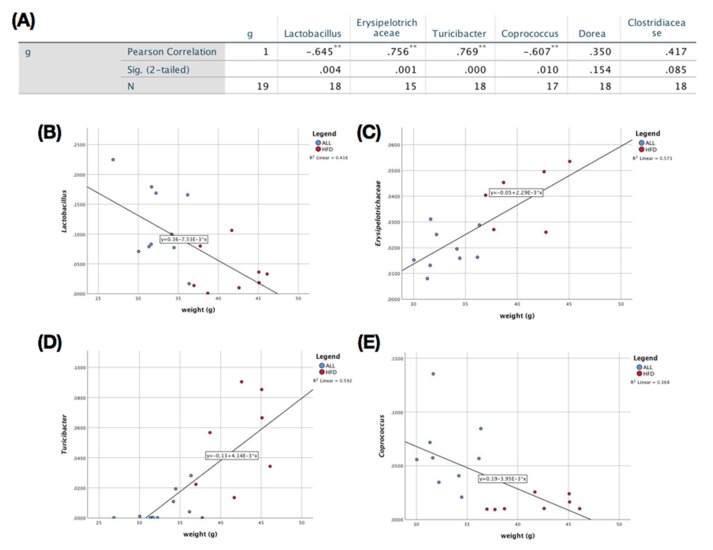
Figure 5.
Correlation of microbiota with body weight. (A) Significance chart for Pearson’s correlation between microbiota and body weight. Correlation between body weight and the relative abundance of (B) Lactobacillus; (C) Erysipelotrichaceae; (D) Turicibacter, and (E) Coprococcus. HFD, high-fat diet (AIN-76, 20% fat, 1% cholesterol); ALL, (HFD + 5% D-allulose). Significance calculated through bivariate Pearson’s correlation analysis with body weight, * p < 0.05, ** p < 0.01.

