
Figure 3. Detailed characterization of BCKA metabolism in cardiac mitochondria.
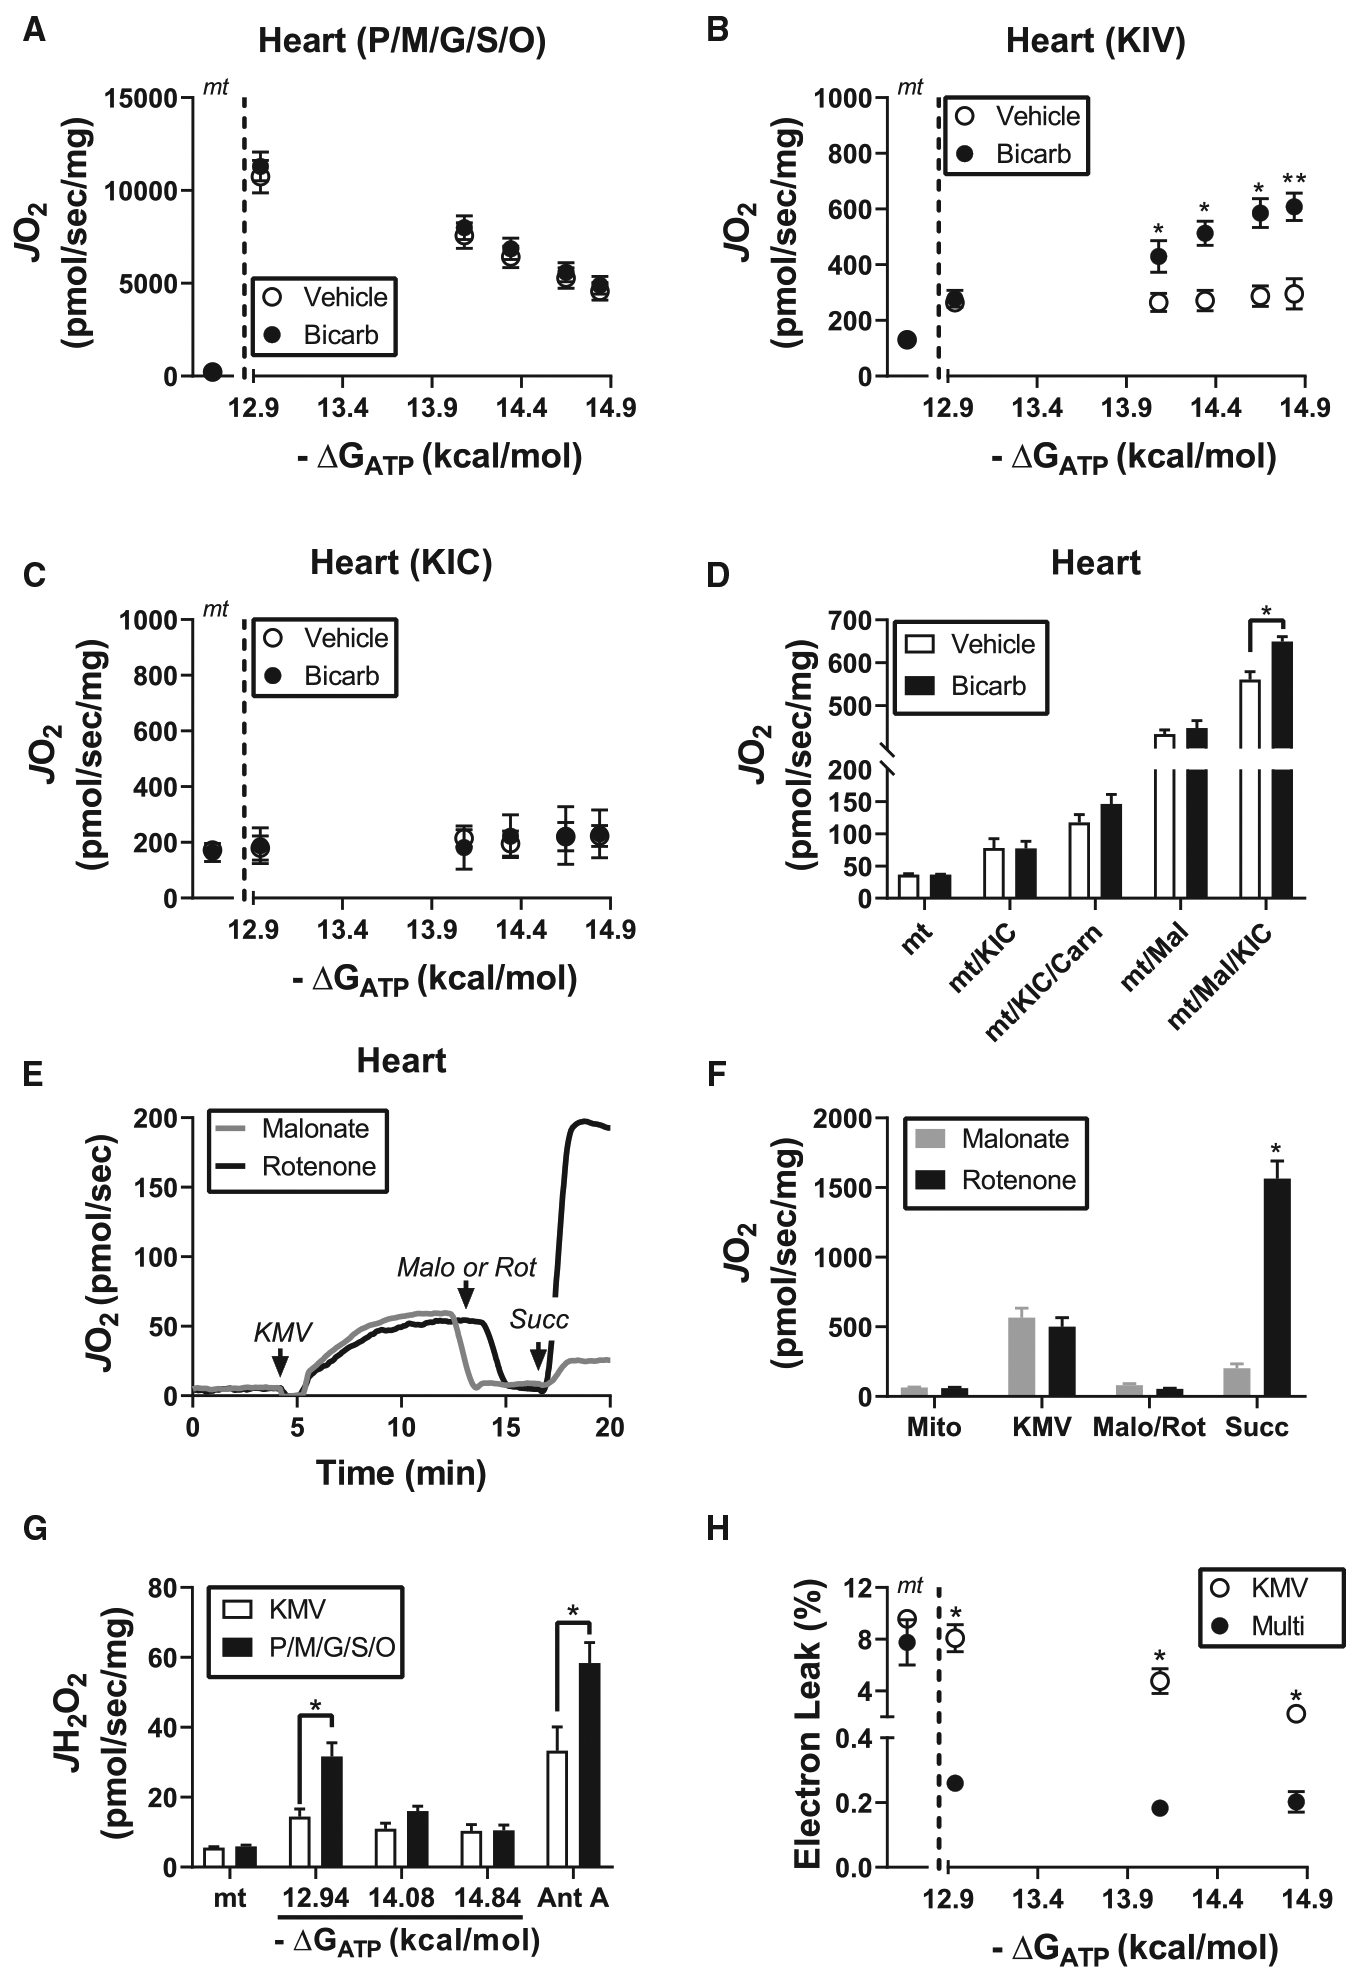
Isolated heart mitochondria were used for all experiments. All bicarbonate conditions were done in the presence of 2 mM bicarbonate. (A) Relationship between mitochondrial oxygen consumption and ATP-free energy in heart mitochondria energized with P/M/G/S/O. Rates to the left of the dotted line correspond to mitochondria alone (‘mt’). (B,C) Relationship between mitochondrial oxygen consumption and ATP-free energy in the presence of (B) KIV or (C) KIC. Rates to the left of the dotted line correspond to mitochondria alone (‘mt’). (D) Mitochondrial ΔGATP was set to −14.84 kcal/mol and JO2 was assessed under the following substrate combinations: mitochondria alone (‘mt’), KIC (‘mt/KIC’), KIC plus 5 mM carnitine (‘mt/KIC/Carn’), malate (‘mt/Mal’) and malate plus KIC (‘mt/Mal/KIC’). (E) Representative JO2 trace depicting KMV-supported flux followed by the sequential additions of either rotenone (5 μM) or malonate (‘Malo’; 5 mM) and then succinate (1 mM). Of note, mitochondrial ΔGATP was set to −14.84 kcal/mol and bicarbonate was present during the experiment. (F) JO2 quantification of the experiment in (E). (G) H2O2 production in heart mitochondria in the presence of either KMV or P/M/G/S/O assessed at various ATP-free energies. Antimycin A (5 μM) was added at the end of the protocol to serve as a positive control. (H) Relationship between electron leak (% Leak = JH2O2/JO2) and ΔGATP for both substrate conditions. Data are mean ± SEM, n = 3–4/group, *P < 0.05, **P < 0.001.