
Figure 5. Comparison of BCKA oxidation in skeletal muscle versus liver mitochondria.
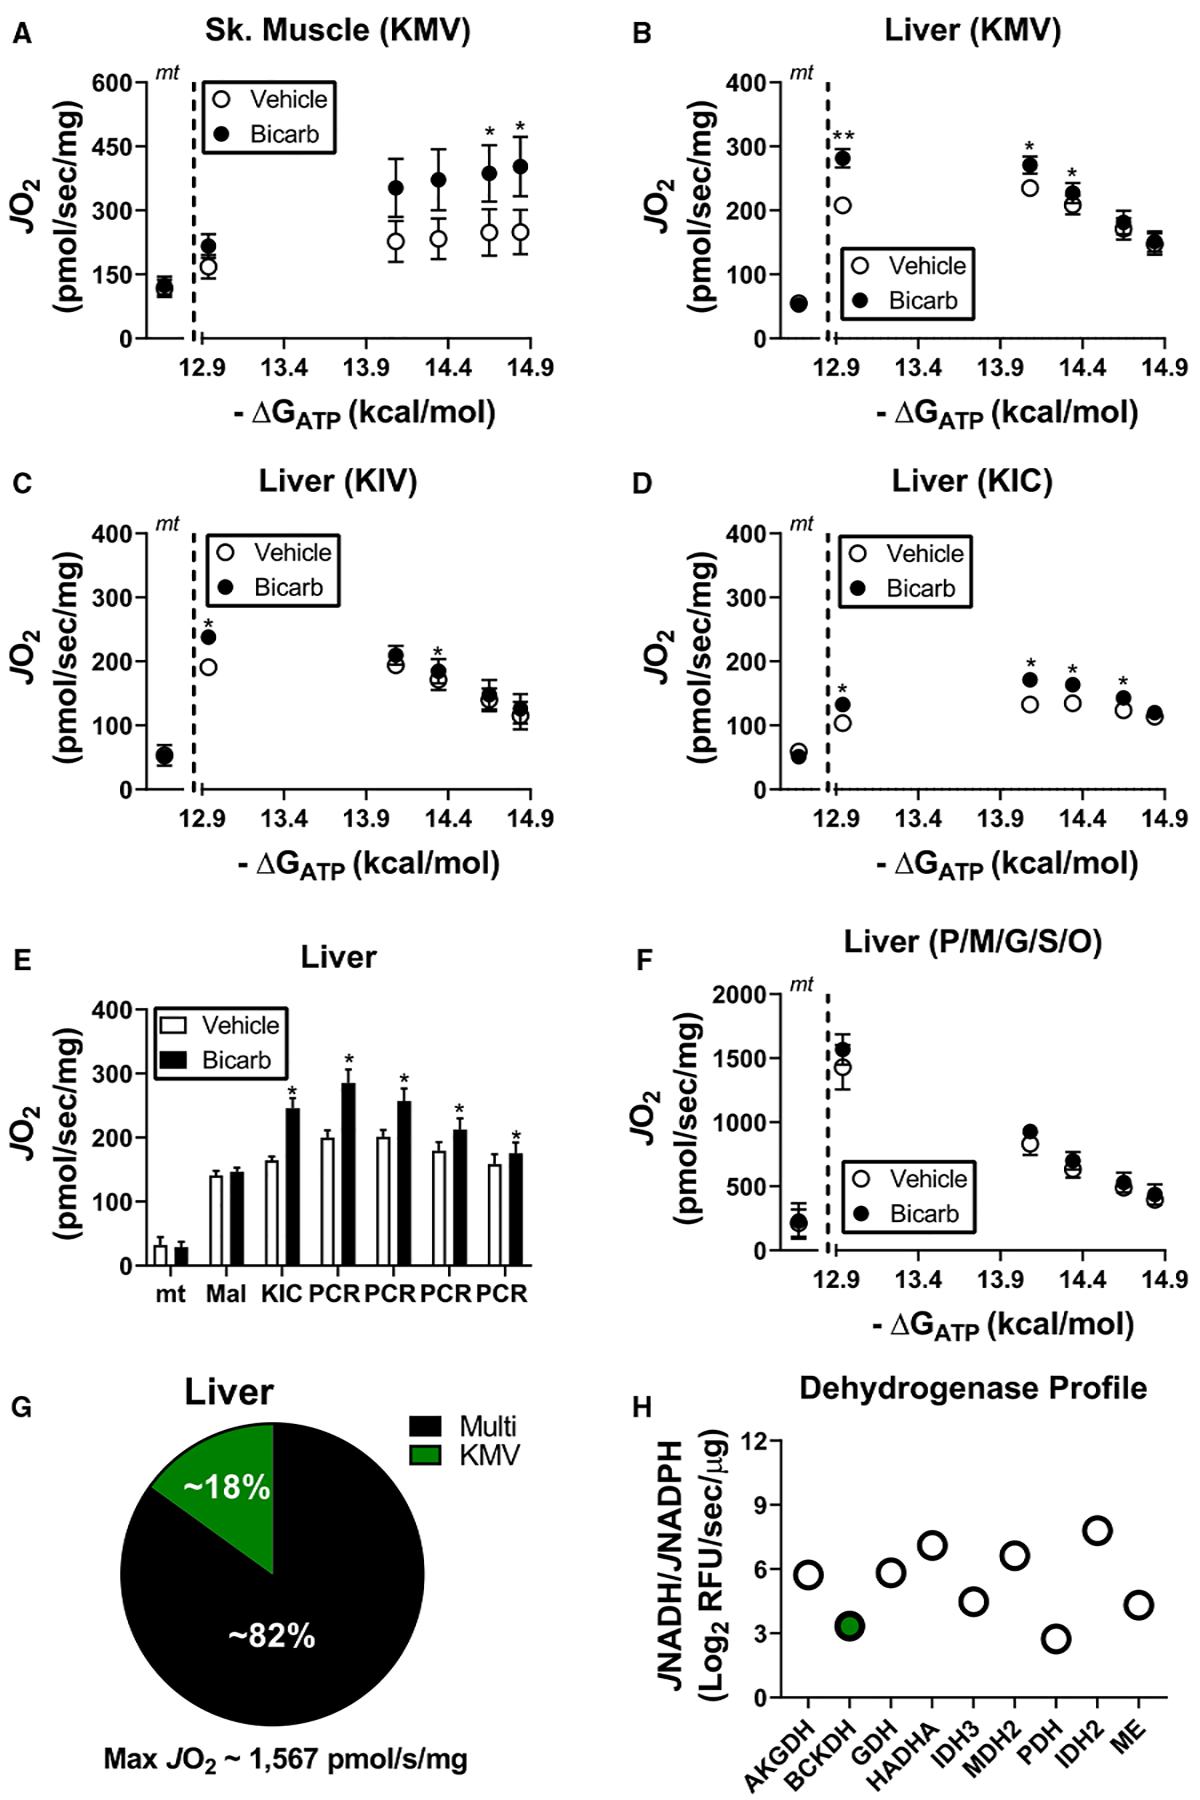
(A–F) Experiments were performed in the presence and absence of bicarbonate (2 mM). (A) Relationship between mitochondrial oxygen consumption and ATP-free energy in skeletal muscle mitochondria energized with KMV. Rates to the left of the dotted line correspond to mitochondria alone (‘mt’). (B–D) Relationship between mitochondrial oxygen consumption and ATP-free energy in liver mitochondria energized with (B) KMV, (C) KIV, or (D) KIC. Rates to the left of the dotted line correspond to mitochondria alone (‘mt’). (E) JO2 upon energization of liver mitochondria with malate and KIC across a span of ATP-free energies. Sequential PCRs in the figure correspond to final concentrations of 6, 9, 15, and 21 mM. (F) Relationship between mitochondrial oxygen consumption and ATP-free energy in liver mitochondria energized with P/M/G/S/O. Rates to the left of the dotted line correspond to mitochondria alone (‘mt’). (G) Comparison of the average maximal KMV-supported respiration in liver mitochondria versus the average maximal respiratory flux supported by P/M/G/S/O. (H) Dehydrogenase profiling in permeabilized liver mitochondria. BCKDH is highlighted in the green filled circle. Data are expressed as Log2 JNADH/JNADPH. Data are mean ± SEM, n = 4/group, *P < 0.05.