
Figure 6. Comprehensive assessment of heart mitochondrial respiratory control in the presence of BCKAs.
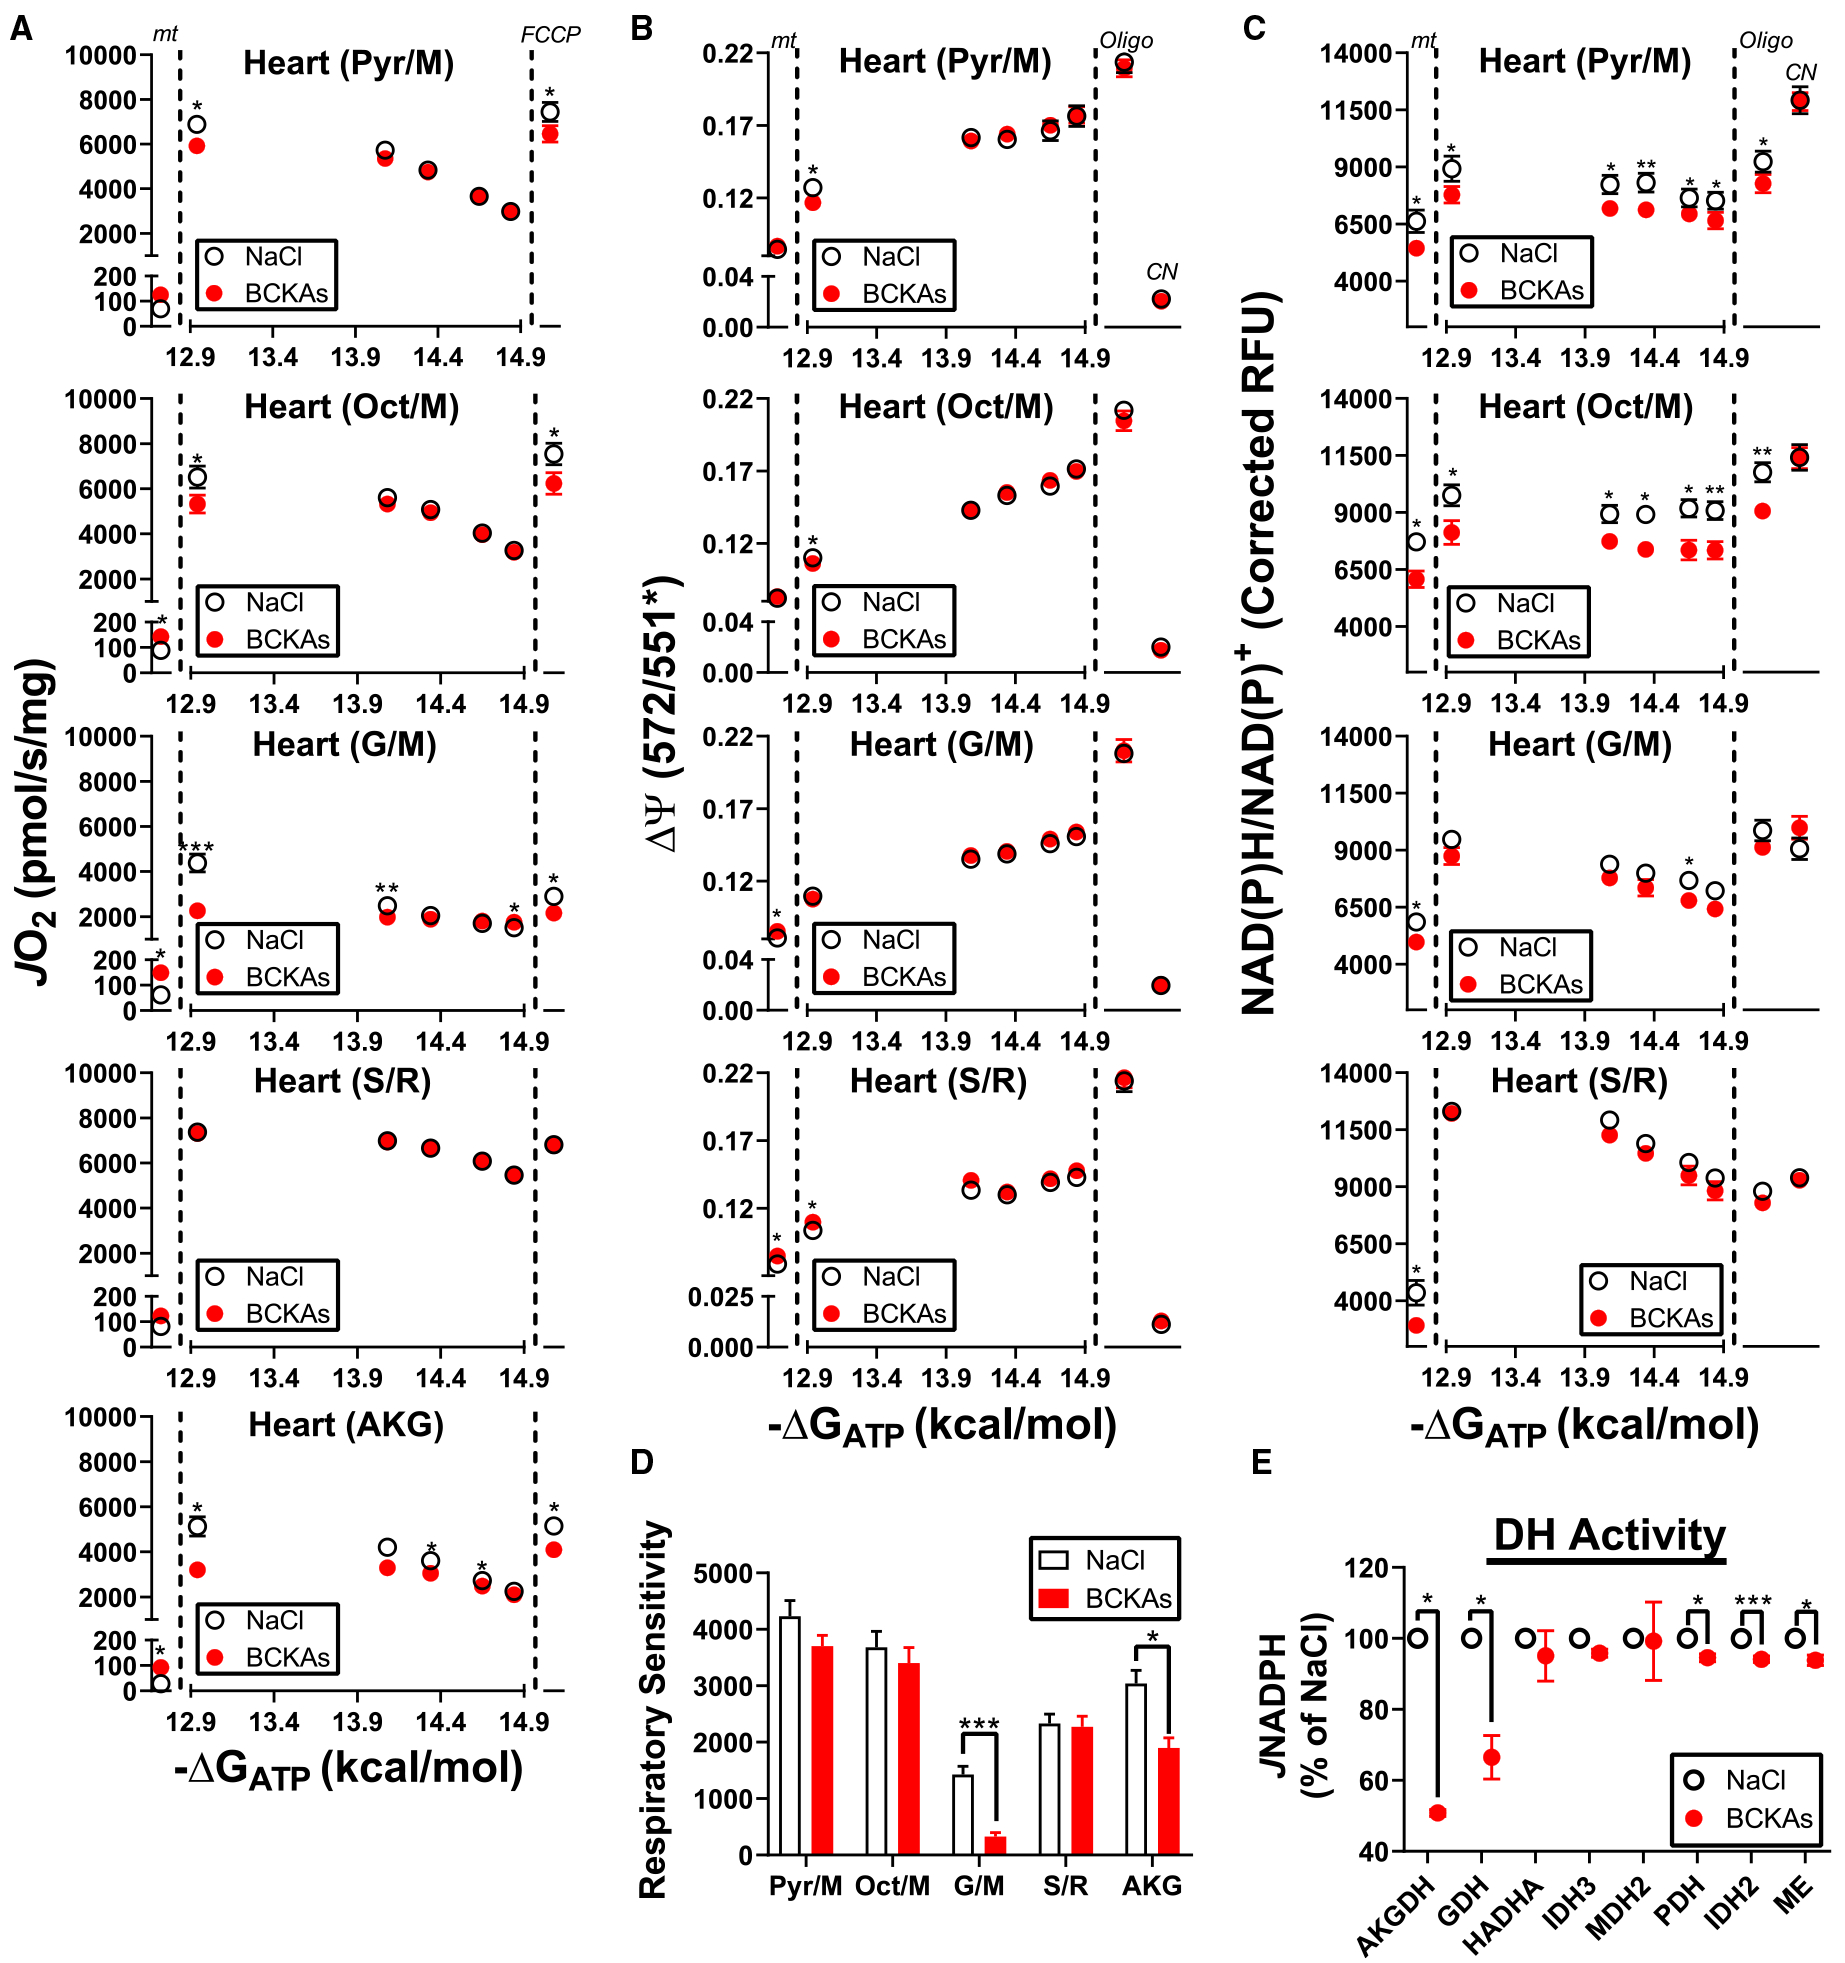
All experiments were performed in isolated heart mitochondria in the presence of either NaCl (3 mM) or a BCKA mixture (1 mM:1 mM:1 mM of KIC/KMV/KIV). (A) Relationship between JO2 and ATP-free energy in mitochondria energized with differing substrates (Pyr/M, Oct/M, G/M, S/R, AKG). Rates to the left of the first dotted line correspond to mitochondria alone (‘mt’). Rates to the right of the second dotted line represent JO2 following the addition of FCCP (2 μM) at the end of the PCR titration (‘FCCP’). (B) Relationship between mitochondrial membrane potential (ΔΨ) and ATP-free energy in mitochondria energized with varying substrates (Pyr/M, Oct/M, G/M, S/R). Values to the left of the first dotted line correspond to mitochondria alone (‘mt’). Values to the right of the second dotted line represent ΔΨ following the addition of oligomycin (‘Oligo’; 5 μM) and cyanide (‘CN’; 10 mM) at the end of the PCR titration. (C) Relationship between NAD(P)H/NAD(P)+ redox and ATP-free energy under the same conditions as in (B). (D) Respiratory sensitivity for each substrate combination determined from the linear change in JO2 as a function of ΔGATP (−14.08 kcal/mol to −14.84 kcal/mol). (E) Dehydrogenase activity in permeabilized heart mitochondria exposed to NaCl or BCKAs. Data are expressed as a percentage of the average NaCl rate for each enzyme. Data are mean ± SEM, n = 6–8/group. *P < 0.05, **P < 0.001, ***P < 0.0001.