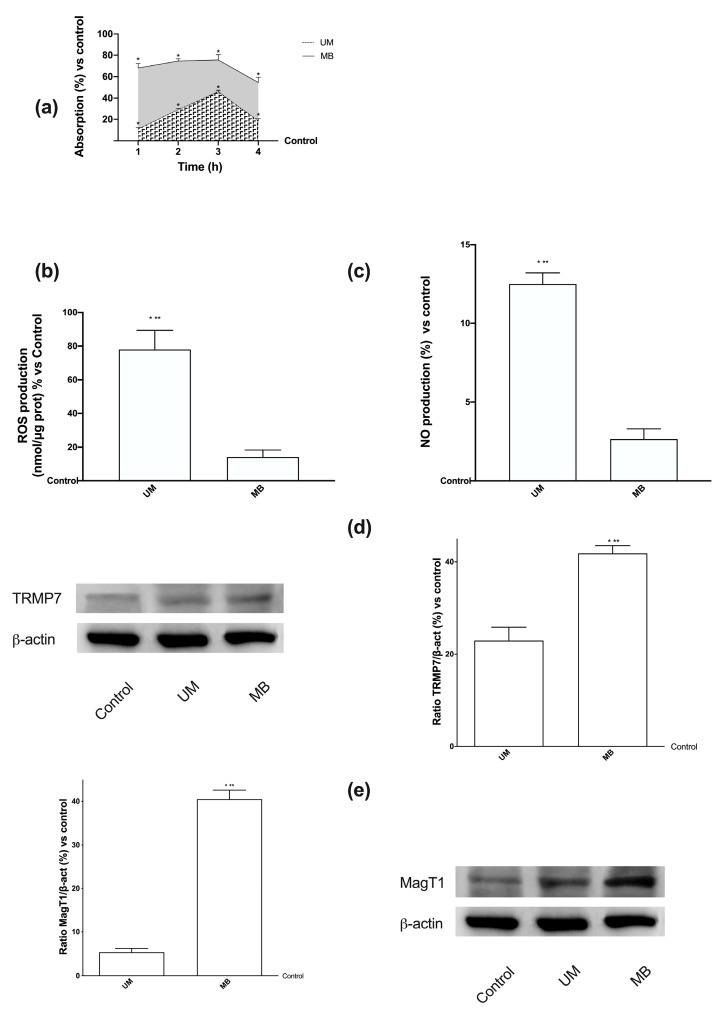
Figure 1.
Magnesium and magnesium transport quantification, and balance of reactive oxygen species (ROS)/nitric oxide (NO) produced on Caco-2 cells. (a) Total Mg absorbed measured at the basolateral level on transwell during time (ranging from 1 h to 4 h). Data are means ± SD (%) compared to control values (line 0%) of four independent experiments produced in triplicate. * p < 0.05 vs. control; p < 0.05 between sucrosomial magnesium (UM) and magnesium-buffered bisglycinate chelate (MB) at the same time point across all time points. (b) ROS analysis measured at 3 h expressed as means ± SD (%) of cytochrome C reduced/µg of protein normalized to control (line 0%) of five independent experiments produced in triplicate. * p < 0.05 vs. control; ** p < 0.05 vs. MB. (c) NO production measured at 3 h normalized to control (line 0%) and expressed as means ± SD (%) of five independent experiments produced in triplicate. * p < 0.05 vs. control; ** p < 0.05 vs. MB. The images reported in (d) and (e) are examples of each protein of five independent experiments reproduced in triplicate. (d,e) Densitometric analysis of TRPM7 and MagT1 expression obtained in whole Caco-2 lysates at 3 h of stimulation. Data are expressed as means ± SD (%) of five independent experiments normalized and verified on β-actin detection. * p < 0.05 vs. control; ** p < 0.05 vs. UM.

