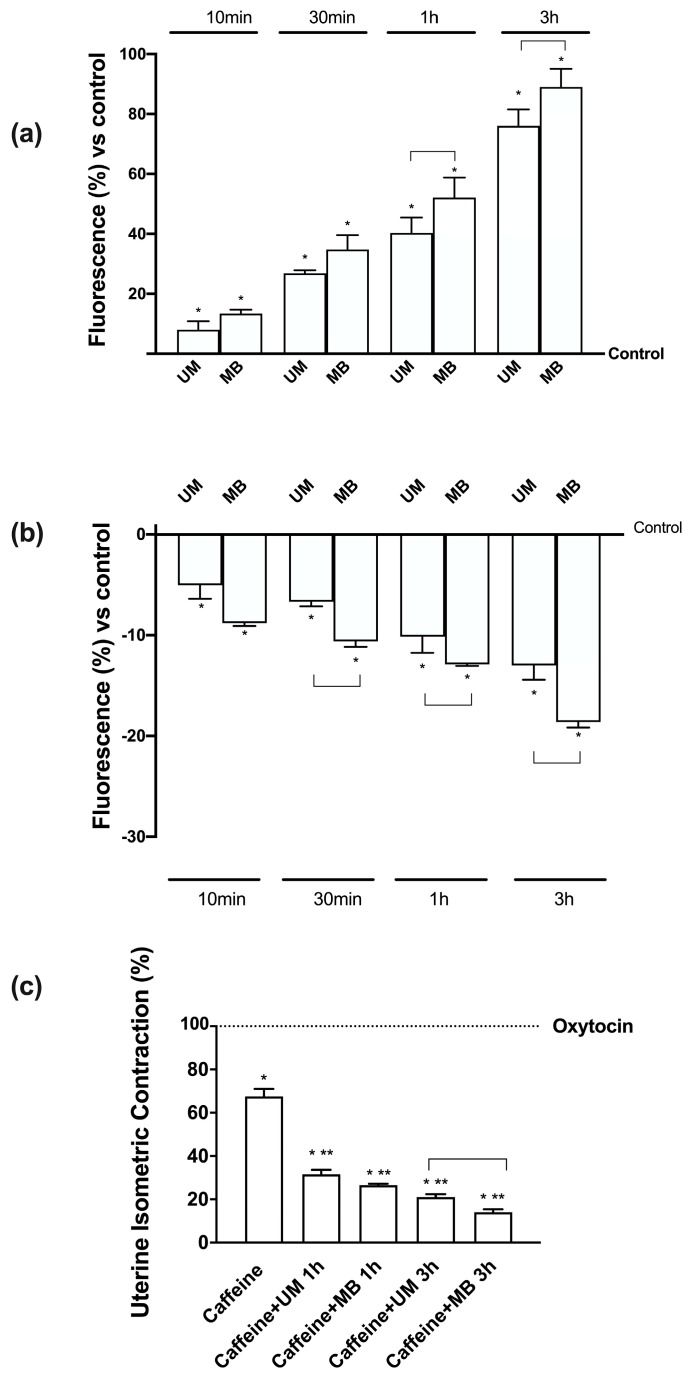
Figure 6.
Measurements of Mg2+ and Ca2+ flux on PHN1-41 cells and mouse contractility assay. (a) Free intracellular magnesium concentration ([Mg2+]i) as measured before (basal [Mg2+]i) and after Mg-loading by UM and MB. After measurement of the basal [Mg2+]i in Na- and Mg-free medium, Caco-2 cells were Mg-loaded by Furaptra, and post-loading [Mg2+]i was calculated from the values measured over time. (b) Free calcium concentration ([Ca2+]) as measured before (basal) and after Mg-loading by UM and MB. After measurement of the basal [Ca2+] in Na-, Ca-, and Mg-free medium, Caco-2 cells were loaded with Fura2, and post-loading [Ca2+] was calculated from the values measured over time. Values are means ± SD (%) of six single experiments. * p < 0.05 vs. control; the bars indicate p < 0.05 between UM and MB at the same time point. (c) Analysis of contractility assay on mouse strips is reported. Data are expressed as means ± SD of four experiments normalized to the maximal contraction obtained using 10−6 M oxytocin. * p < 0.05 vs. oxytocin; ** p < 0.05 vs. caffeine; the bars indicate p < 0.05 between UM and MB at the same time point. The abbreviations are the same as reported in Figure 1.

