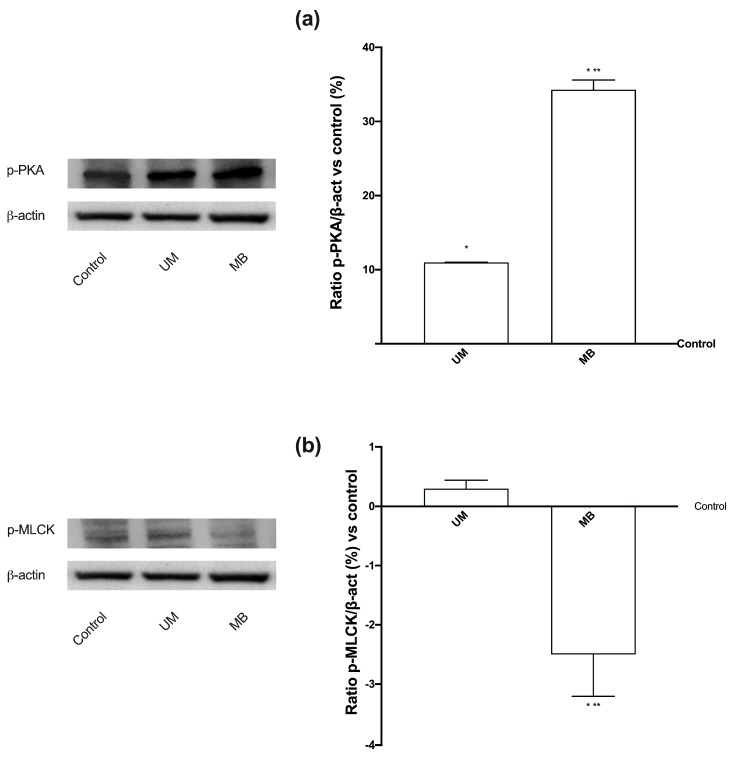
Figure 8.
Western blot and densitometric analysis of PKA and phospho-myosin light chain (MLCK) on PHN1-41 cells. Western blot and densitometric analysis of PKA (a) and p-MLCK (b), analyzed on whole PHN1-41 lysates at 3 h of stimulations. The images reported are an example of each protein from five independent experiments reproduced in triplicate. Data are expressed as means ± SD (%) of five independent experiments normalized and verified on β-actin detection. * p < 0.05 vs. control; ** p < 0.05 vs. UM. The abbreviations are the same as reported in Figure 1.

