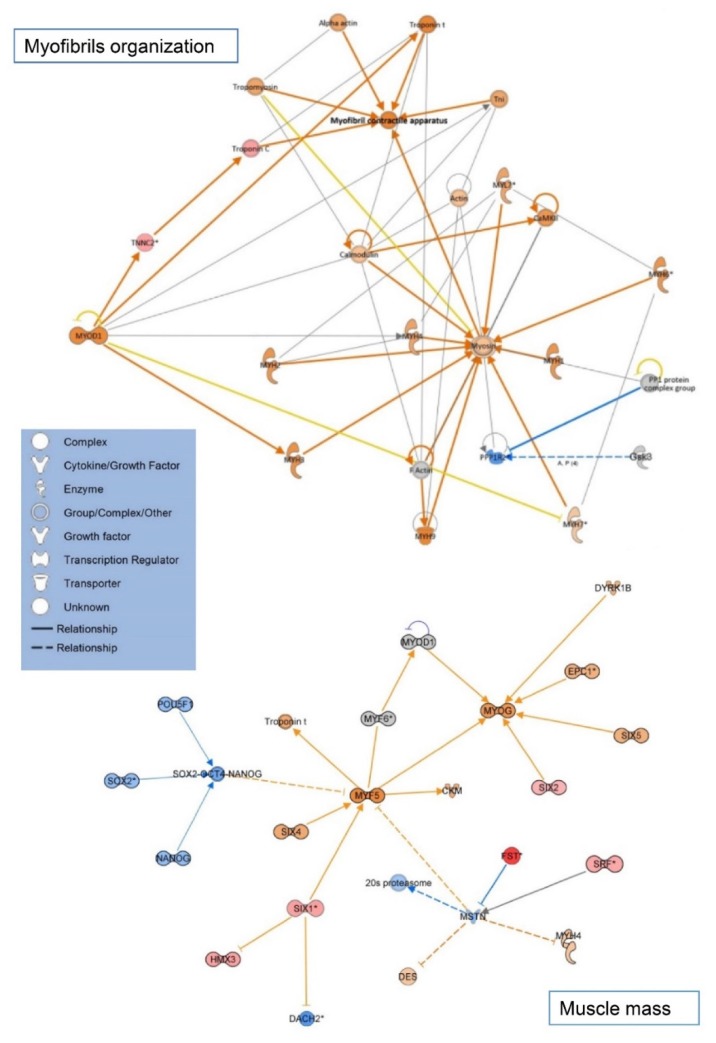
Figure 8.
Biological interaction network of genes of the myofibrils’ organization and muscle mass pathways. Interaction networks were generated for the HF/SD versus HF/RD group comparison using IPA. Genes or gene products are represented as nodes, and the biological relationship between two nodes is represented as an edge. All edges are supported by at least one reference from the literature. Red and blue colored nodes indicate genes with up- and down-regulated expression respectively, in offspring from rats fed HF/SD diet compared with HF/RD diet. The intensity of the colors specifies the degree of up- or down-regulation. Greater intensity represents a higher expression level. Nodes and edges are displayed with various shapes and labels that present the functional class of genes and the nature of the relationships between the nodes.

