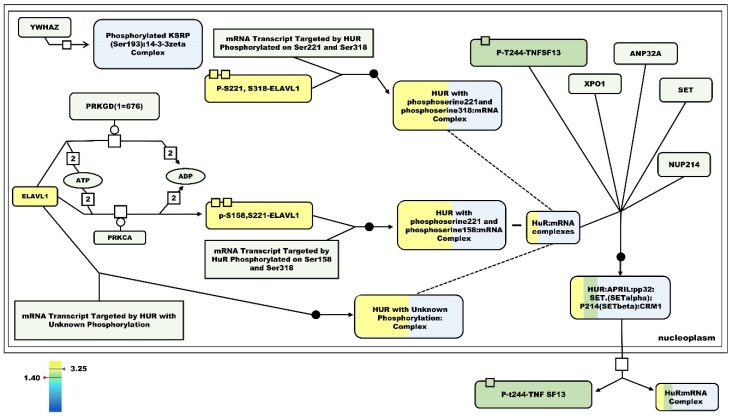
Figure 9.
Elav1 pathway for mRNA stabilization. Entities are colored according to the expression scales when the HF/SD group is compared with the HF/RD group. The key elements in the pathway that are upregulated in HF/SL are shaded in yellowish-green tones, according to the expression scale. Yellowish tones indicate positive fold changes and bluish tones refer to negative fold-changes.

