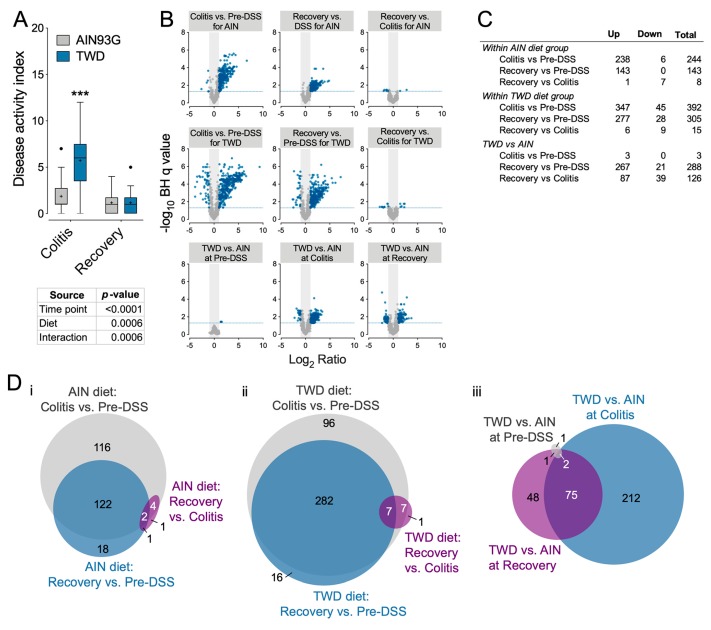
Figure 6.
Expression of immune and cancer pathway genes in colon tissues was impacted to a greater extent in mice fed TWD as compared to those fed AIN during colitis and recovery (Experiment E). (A) Disease activity index (DAI) for mice fed AIN or TWD and given DSS to induce gut inflammation at colitis and recovery time points. (B) Volcano plots depicting immune-related mRNA expression as measured using the NanoString Mouse PanCancer Immune panel. Values shown are log2 ratios for each comparison indicated plotted against the -log10 of the Benjamini–Hochberg FDR q value. A significant difference in gene expression was inferred for genes with BH q value < 0.05 and log2 ratio > 1 or < −1. (C) Number of significant differentially expressed genes across time points within each diet or comparing AIN vs. TWD at each time point. (D) Proportional Venn diagrams depicting the number of genes identified as differentially expressed in colon tissues of mice fed either AIN or TWD diets. Comparisons were made by time point for AIN diet (i), by time point for TWD diet (ii), or by diet at each time point (iii).

